Uncomplicated Financial and EPM Dashboard Software Solutions for All Users
Time-Consuming Inefficiencies Rule Your Current Financial Reporting Process
Financial Reports are Static, Bulky, and Text Heavy
Even when you’re a seasoned CFO, traditional raw, tabular reports are hard to consume. The data take time to interpret and analyze, which is the last thing your C-suite needs to worry about when facing a decision that will impact the business.
High-Value Financial Resources are Quickly Burning Out
Finance has become a service go-to for others who need access to strategic, financial information. But when your financial reports are not readable by non-technical folks, you have to spend extra time on formatting.
Sharing Accurate Reports for Decision Making is Not Easy
Manually sharing data is error-prone and takes away from critical analysis. Without the ability to instantly distribute accurate reports at the click of a button, you’re wasting valuable financial resources on administrative tasks.
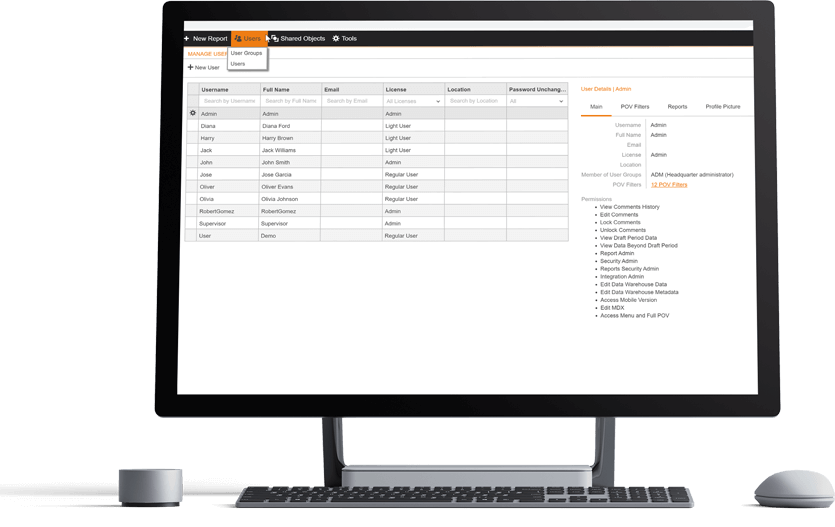
Create, Manage, and Distribute Reports Without IT
Put your finance team back in the driver’s seat with self-service reporting and dashboards. With an intuitive, user-friendly interface, insightsoftware’s financial dashboard solutions provide the tools for everyone in your organization to build reports and EPM dashboards with maximum ease and flexibility.
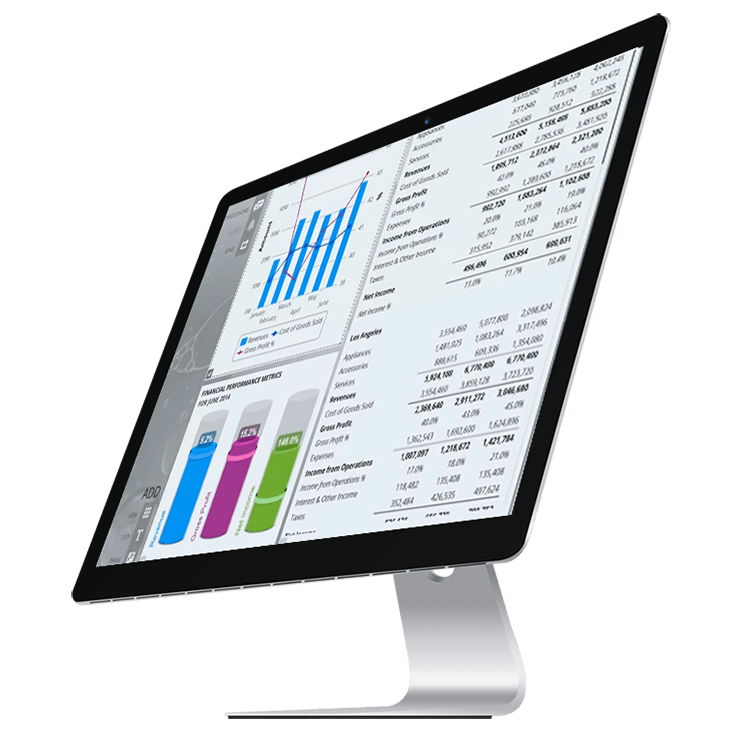
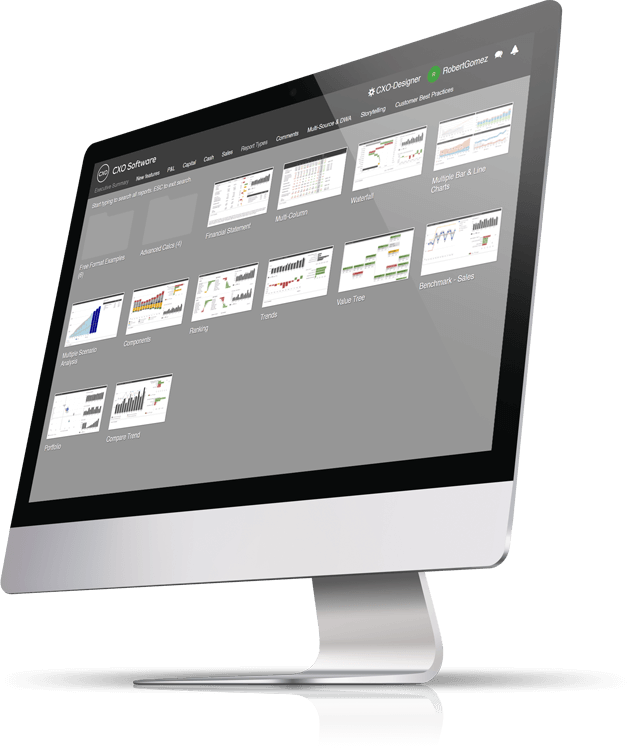
Quickly Access In-Depth Analytics
Explore your data by drilling down and uncovering deeper insights to understand what really makes up the figures. Foresee trends by focusing on the data that matters, and plan ahead to help your company move forward.
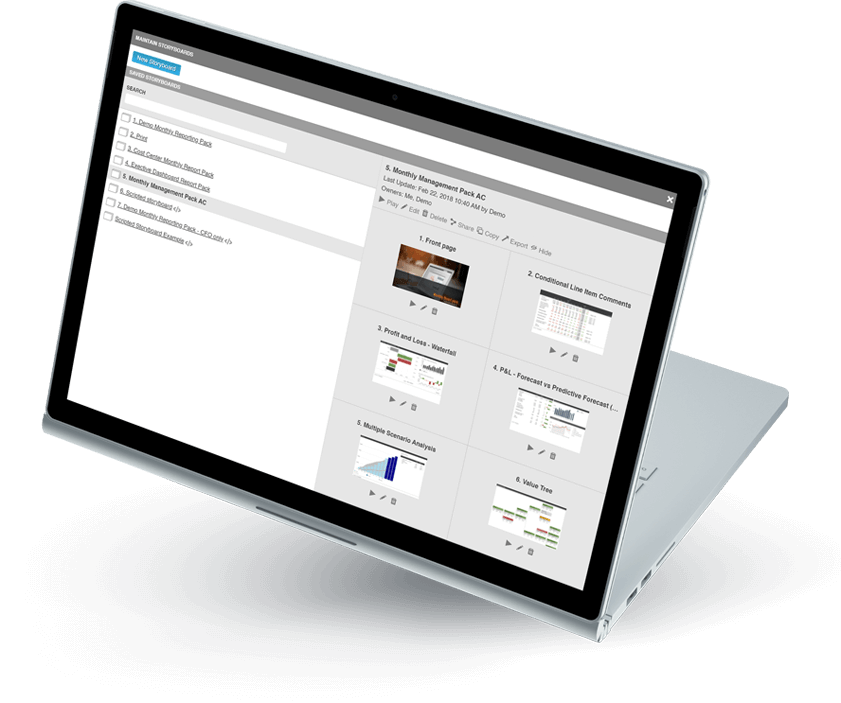
Tell the Story Behind the Numbers
Effective financial storytelling involves more than simply distributing monthly financial statements with a few accompanying footnotes. It should be about conveying business performance by guiding executives directly to the key insights behind the data.
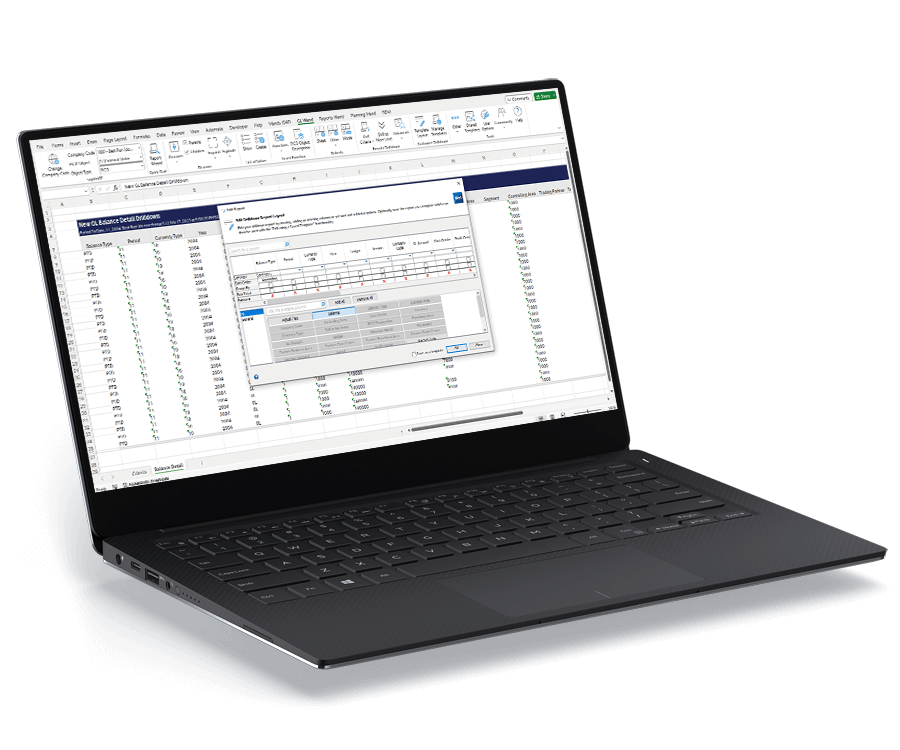
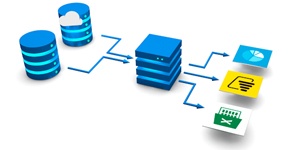
Connect Your EPM Data for the Ultimate Dashboard
Never question data accuracy or integrity again. Our software connects directly with your EPM data source and is supported by automated data flows. You can also integrate non-financial data into your EPM dashboards for total insight into performance.
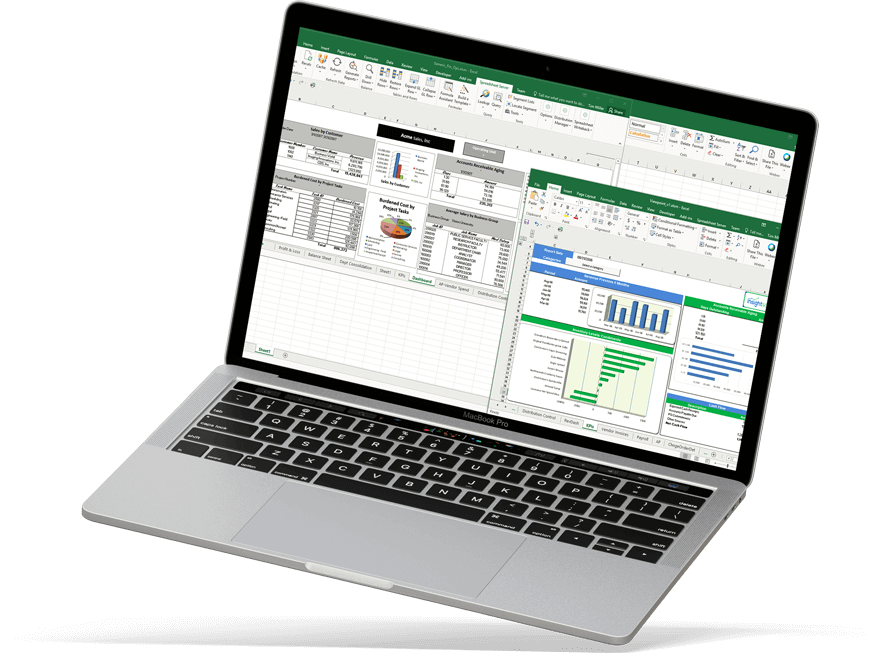
Flip the Financial Reporting Paradigm
Through process standardization, a modern visual analytics solution can enhance all aspects of the reporting cycle, shifting the emphasis from basic, manual tasks to actionable, value-added insight and analysis. With one version of the truth and flexible Excel-like formulas, your finance team can now focus on what they do best.
Integrates with:
- Oracle E-Business Suite (EBS)
- Oracle EPM Cloud
- Oracle ERP Cloud
- Oracle Essbase
- Oracle Financial Consolidation and Close (FCCS)
- Oracle Fusion
- Oracle Hyperion Enterprise
- Oracle Hyperion Financial Management (HFM)
- Oracle Hyperion Planning
- Oracle PeopleSoft
- Oracle Planning and Budgeting Cloud Service (PBCS)
- Oracle Tax Reporting

- Dynamics 365 Business Central
- Dynamics 365 Finance and Supply Chain Management
- Dynamics AX
- Dynamics CRM
- Dynamics GP
- Dynamics NAV
- Dynamics NAV C5
- Dynamics SL
- SQL Server Analysis Services (SSAS)

- Deltek Ajera
- Deltek Maconomy
- Deltek VantagePoint
- Deltek Vision
- Deltek Vision Cloud

- Viewpoint Spectrum
- Viewpoint Vista

- MRI Commercial Management
- MRI Financials
- MRI Horizon
- MRI Horizon CRE
- MRI Qube Horizon
- MRI Residential Management
- Epicor Avante
- Epicor BisTrack
- Epicor CMS
- Epicor Enterprise
- Epicor Epicor SLS
- Epicor iScala
- Epicor Kinetic
- Epicor LumberTrack
- Epicor Manage 2000
- Epicor Prophet 21
- Epicor Tropos

- Infor CloudSuite Financials
- Infor Distribution SX.e
- Infor Financials & Supply Management
- Infor Lawson
- Infor M3
- Infor System21
- Infor SyteLine
- Sage 100
- Sage 100 Contractor
- Sage 200
- Sage 300
- Sage 300 CRE (Timberline)
- Sage 500
- Sage 50cloud Accounting
- Sage AccPac
- Sage Adonix Tolas
- Sage Estimating
- Sage Intacct
- Sage MAS
- Sage X3
- 24SevenOffice
- A+
- AARO
- AccountEdge
- Accounting CS
- Accountmate
- Acumatica
- Alere
- Anaplan
- Aptean
- Assist
- ASW
- Aurora (Sys21)
- Axion
- Axis
- BAAN
- Banner
- Blackbaud
- BlueLink
- Book Works
- BPCS
- Cayenta
- CCH
- CDK Global
- CedAr e-financials
- CGI Advantage
- Clarus
- CMiC
- CMS (Solarsoft)
- Coda
- Coins
- Colleague
- CPSI
- CSC CorpTax
- Custom
- CYMA
- DAC
- Data Warehouse
- Datatel
- DATEV
- Davisware Global Edge
- Davisware S2K
- Deacom
- DPN
- e5
- eCMS
- Eden (Tyler Tech)
- Emphasys
- Entrata
- Etail
- Expandable
- FAMIS
- Famous Software
- Fern
- FinancialForce
- FireStream
- FIS
- FiServ
- Flexi
- Fortnox
- Foundation
- Fourth Shift
- Friedman
- Full Circle
- GEMS
- Harris Data (AS/400)
- HCS
- HMS
- IBM Cognos TM1
- IBS
- IBS-DW
- In-House Developed
- Incode
- INFINIUM
- IQMS
- iSuite
- Jack Henry
- Jenzabar
- JobBOSS
- Jonas Construction
- M1
- Macola
- MACPAC
- Made2Manage
- MAM
- MAM Autopart
- Manman
- Mapics
- McLeod
- MEDITECH
- MFG Pro
- MicrosOpera
- MIP
- Mitchell Humphrey
- Movex
- MRI
- MSGovern
- Munis (Tyler Tech)
- New World Systems
- Onesite
- Onestream XF
- Open Systems
- PDI
- Penta
- Plexxis
- PowerOffice
- PRMS
- Pro Contractor
- ProLaw
- Q360
- QAD
- Quantum
- Qube Horizon
- QuickBooks Desktop Premier
- QuickBooks Desktop Pro
- Quickbooks Enterprise
- QuickBooks Online
- Quorum
- RealPage
- REST API
- Retalix
- Ross
- SmartStream
- Spokane
- Springbrook
- Standalone DB with ODBC/DSN connection
- Standalone IBM DB
- Standalone Oracle DB
- Standalone SQL DB
- SUN
- Sunguard
- SunSystems
- Sys21
- SyteLine
- TAM (Applied Systems)
- Thomson Reuters Tax
- Timberline
- TIMELINE
- Traverse
- TripleTex
- Unit4
- Unit4 Agresso
- Unit4 Business World
- Unit4 Coda
- USL Financials
- Vadim
- VAI-System 2000
- Vantage
- Vertex
- Visma
- Winshuttle
- Wolters Kluwer CCH Tagetik
- WorkDay
- Xero
- xLedger
- Xperia
- Yardi
- Yardi-SaaS

Top 10 Best Practices for Financial Reporting in Excel
From financial statements to annual reports, accurate reporting is essential to the livelihood of your business. Microsoft Excel is one of the most widely used analysis tools, and most businesses use it to manage their data and create reports.
In this whitepaper, insightsoftware gives you 10 easy ways to improve your reporting practices in Excel.
You will learn,
- How to make your reports more interactive
- Tune your reports for performance
- Increase report usability through these tried and true techniques
Complete the form now and a copy of this resource will be delivered to your email.
Work With the #1 Financial Reporting Vendor for ERPs and EPMs

It was a huge relief to be able to hook up Power BI to Jet and avoid the complicated Dynamics NAV database setup usually required. All the hard work was already done for me!
Speak to an Expert