Get Easy Access to AnswersWhen & Where You Need Them
Required Expertise Hinders Reporting
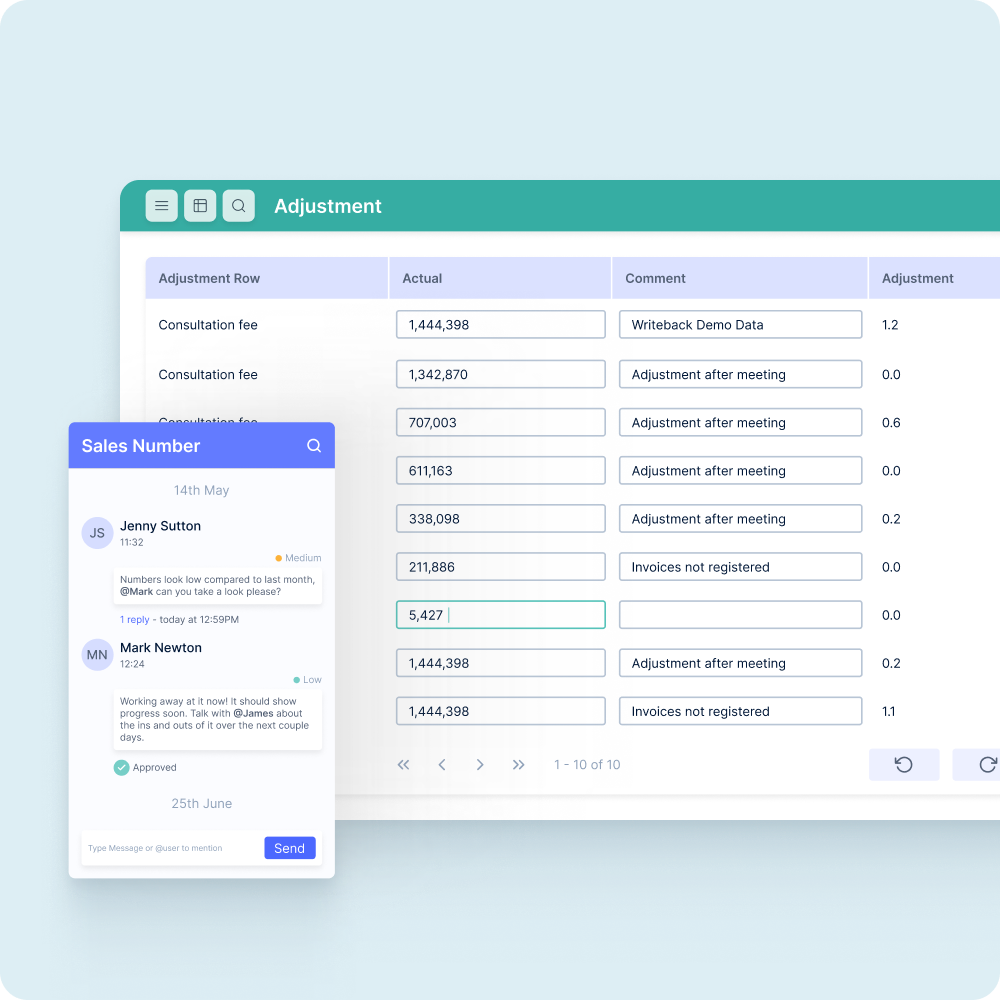
It’s hard to make informed decisions and drive effective change when you have to rely on a technical specialist to create and edit dashboards. This can result in delays of days or weeks, slowing down decision cycles. Instead, use Jet Reports for Excel-native self-service dashboards (no SQL required).
Lack of Data Visibility
Most ERP solutions were built to collect data, not to report on it. Accessing data from thousands of tables and formatting it in a consumable way is not an easy task, often leading to labor-intensive reporting and maintenance nightmares. Using a tool like Jet Analytics can speed up data quality checks and enhance transparency.
A Single Source of Truth is Missing
Without an easy way to share reports and collaborate between departments, your organization is not making the data-driven decisions it needs. Conflicting numbers, multiple versions of “the truth,” and endless reconciliation undermine trust in your data. Our Jet Reports Center centralizes all of this on a single URL for easy access.
Get the Right Data to the Right People at the Right Time
Create Business Dashboards Directly Inside Excel
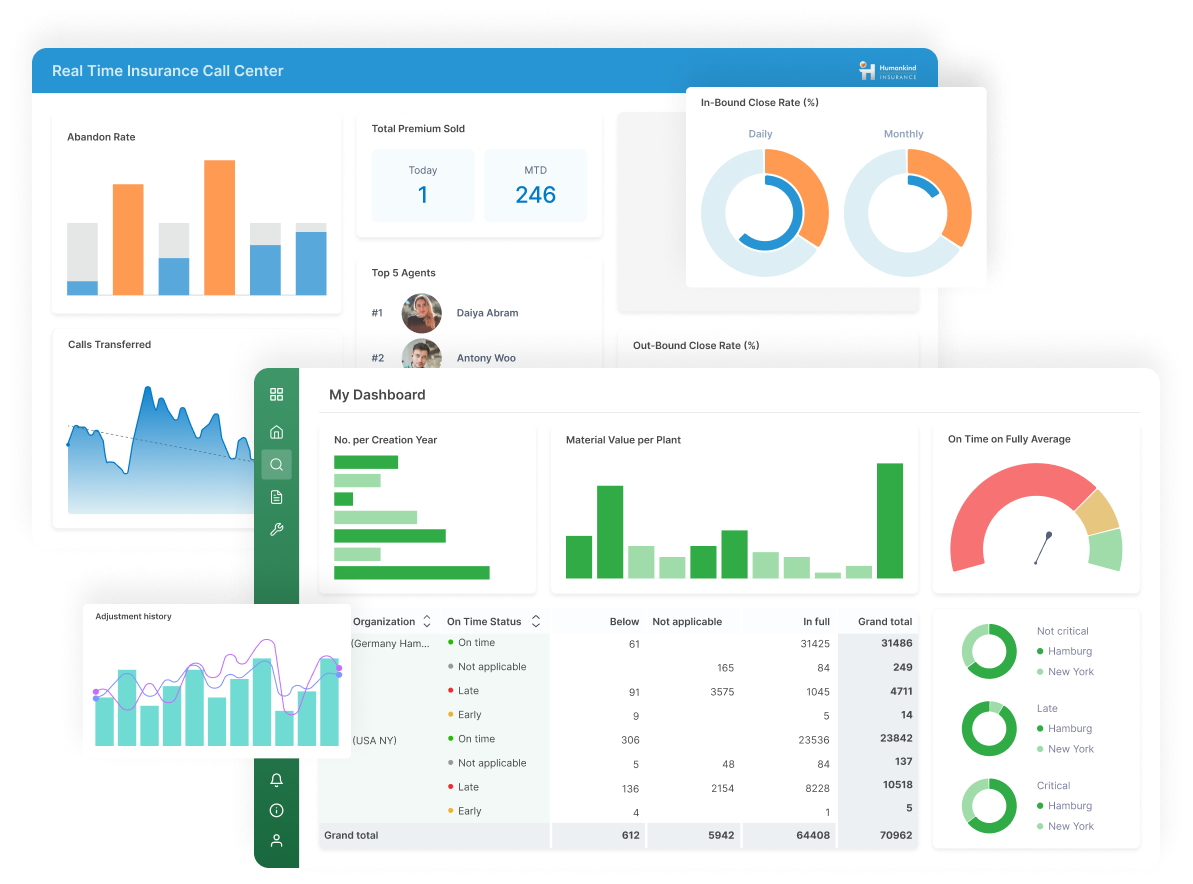
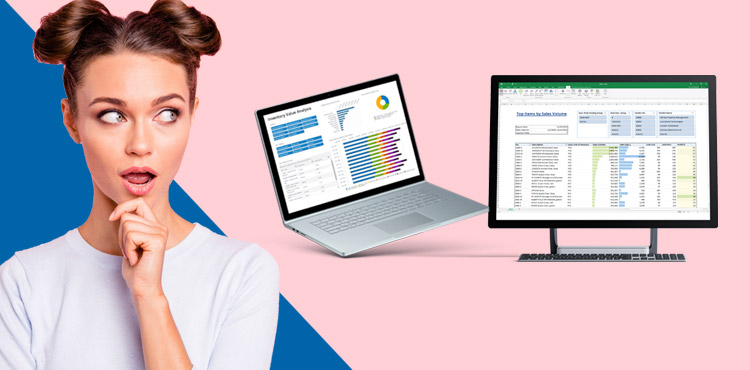
Effortlessly uncover hidden gems in your raw data with Jet Reports. Forget the frustration of deciphering complex ERP structures. Our intuitive tool lets you drag and drop the metrics you need into a user-friendly interface, no technical wizardry required. Craft stunning business intelligence dashboards in a flash and gain a crystal-clear view of your company’s health to make data-driven decisions with supreme confidence. Explore trends, identify areas for improvement, and track progress over time, all within the familiar comfort of Excel.
Access your data anytime, anywhere. Excel, web browser, mobile device — the choice is yours. Instantly group and filter data to pinpoint root causes and uncover key trends, all on virtually any device with a web browser. Ditch the wait for IT by empowering your team with self-service analytics and unleashing the hidden potential of your information. Collaborate and share findings seamlessly across departments, breaking down information silos and accelerating decision-making.
Instill confidence in your data-driven decisions with the power of accuracy and governance. Publish and share interactive dashboards that everyone can trust. Gone are the days of outdated spreadsheets and conflicting information. Schedule automatic updates at regular intervals so that your team is always on the same page (literally). With the most current, reliable data at their fingertips, they’ll be able to make more informed, strategic choices that drive business success.
Cut through the BI clutter! Identify your data needs and choose the perfect platform. To learn more, download our free whitepaper, How to Compare Business Intelligence Solutions, today.
In simple terms, a business dashboard is a visual display of your company’s KPIs, metrics, and key data points, all unified into a single interface. These tools take raw data from systems like your ERP, CRM, and financial platforms to transform it into intuitive charts, tables, and scorecards. These dashboards give decision-makers insightful, real-time snapshots of business performance.
Why are business dashboards important?
Not only do modern business performance dashboards inform real-time decision making so you can react immediately to trends, but they also offer an effective way to align on goals. When your team has a unified view of KPIs via these dashboards, everyone works from the same set of facts. When everyone is aligned and has visibility into the performance of their department, it improves accountability. Better alignment and easy automation further enhance efficiency so you don’t have to spend hours each month exporting, cleaning, and formatting data to analyze.
What are examples of business dashboards?
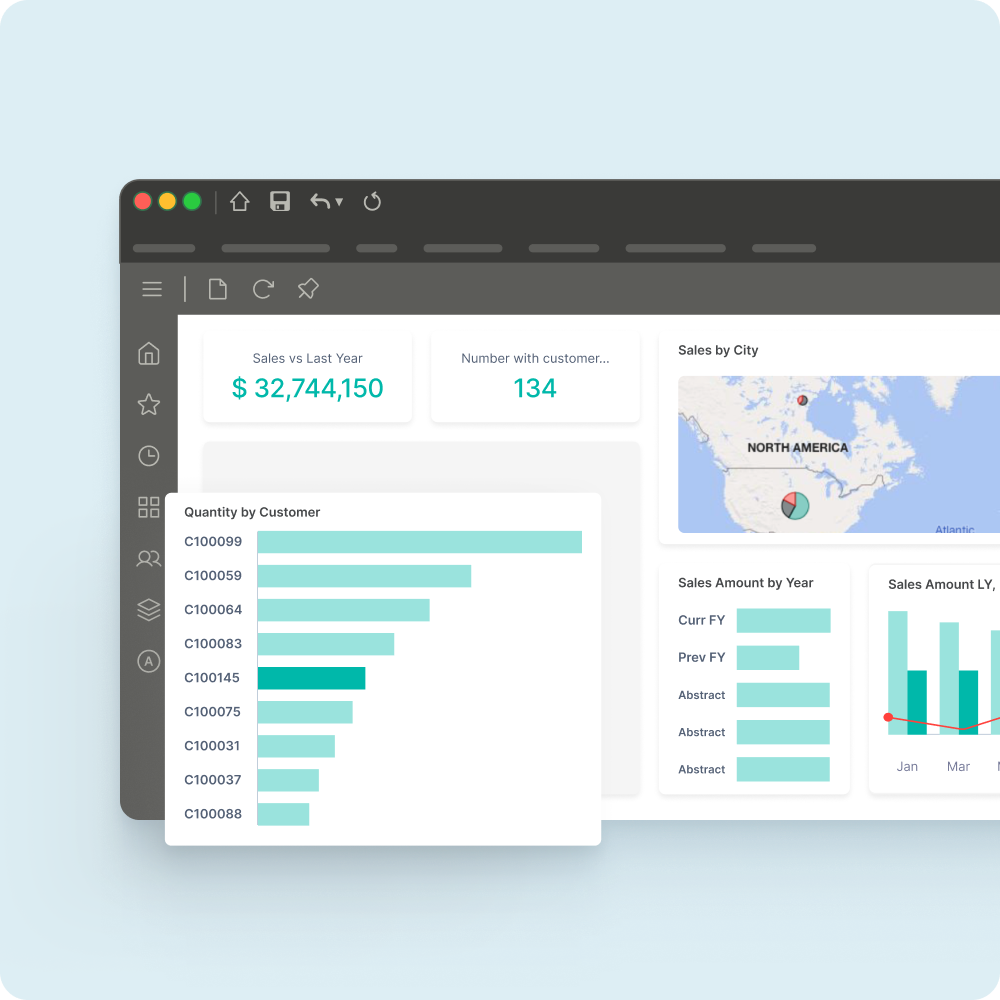
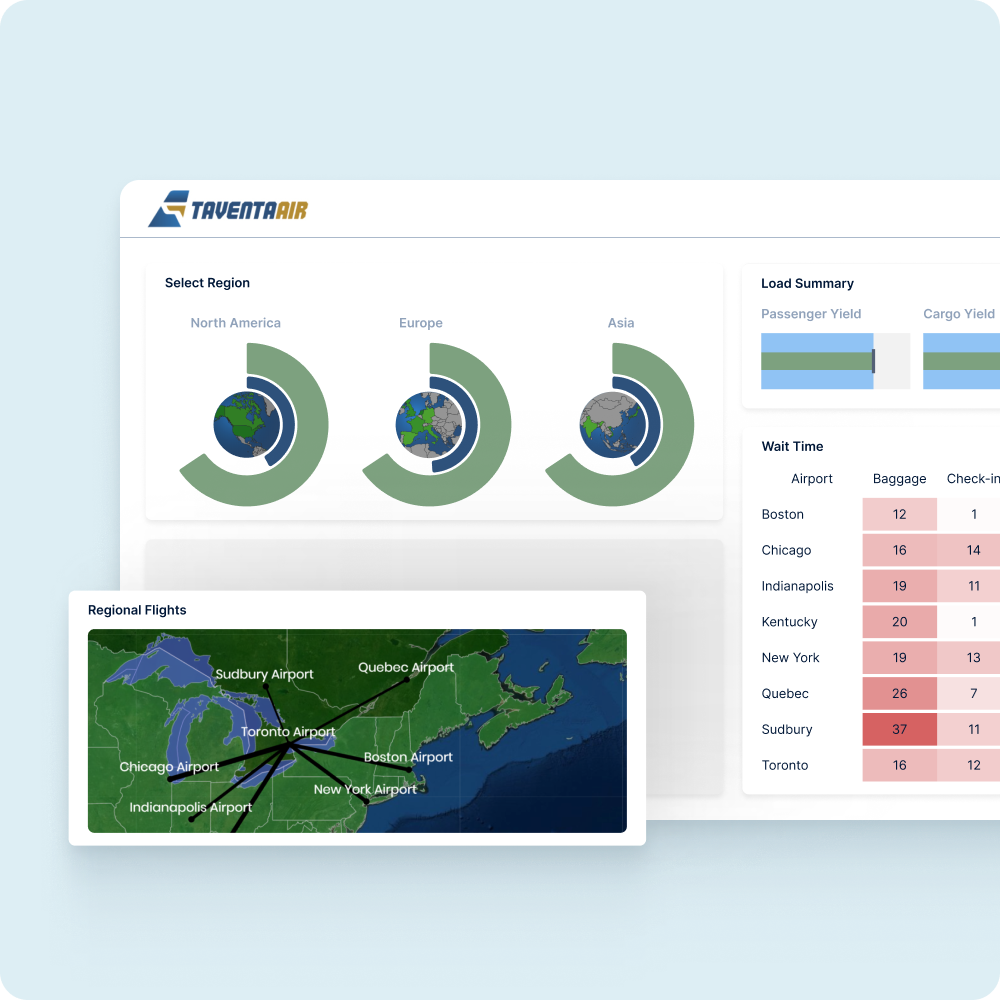
To help visualize what business dashboards could be used for, imagine an executive KPI dashboardthat shows high-level metrics like revenue, gross margin, and other key data with trendlines and variance analysis. Another example might be a sales performance dashboardthat shows the closed-won pipeline, win rates by rep (or region), and average deal size. Performance dashboards can be extended to other business areas like manufacturingto show KPIs like production throughput, machine utilization, and defect rates. All of these get updated in real-time based on data from your other systems, keeping everyone informed and in the loop.
What are the different types of dashboards?
The four most common types of dashboards are operational, strategic, analytical, and tactical:
Operational dashboards primarily focus on real-time monitoring of day-to-day operations, like inventory levels or service calls.
Strategic dashboards emphasize higher-level metrics that align with long-term goals, such as EBITDA or market share.
Analytical dashboards are meant for deep dive data breakdowns and investigations using filters, drill-downs, and comparisons.
Tactical dashboards bridge the gap between operational and strategic dashboards by displaying metrics relevant for departmental managers to optimize processes.
What is the five-second rule for dashboards?
The five-second rule of dashboards recommends that the audience should be able to take away at least one piece of relevant information within five seconds of viewing the dashboard. In other words, the main point or insight should be immediately apparent and not force users to locate key metrics or interpret complex visuals. We recommend using concise labels, consistent color legends, and placing primary KPIs at the top.
What kind of data can be included in my dashboards?
Our dashboards are flexible and can connect to a wide range of data sources, including your ERP system, CRM, marketing automation platform, and even external databases. This means that you can use profit and loss, cash flow, win-loss analysis, customer churn, manufacturing throughput, service ticket volumes, employee turnover, time-to-hire, website traffic, campaign ROI, and much more in your dashboards.
Do I need any coding experience to build dashboards?
Not at all! Our drag-and-drop interface makes it easy for any business user to create dashboards without any coding knowledge. Simply select the data you want to see and choose the visualizations that best suit your needs.
How can I create a business dashboard?
Start by connecting your data — insightsoftware’s connectors make it easy to link your ERP, CRM, or other databases. Using your dashboard tool, define dimensions and hierarchies. Then, begin building your dashboard’s layout. If you’d like to avoid starting from scratch, dashboard software like Jet Reports provides pre-built industry-specific templates to get you off the ground and running in no time. Customize your business dashboard with relevant charts, tables, and other visualizations to display important KPIs. Keep in mind that this can be complicated when done manually, but platforms like Jet Reports can create dashboards within Excel using intuitive drag-and-drop tools. Once your dashboard is complete, don’t forget to share it with the rest of your team!
How can I create a business dashboard for Microsoft Dynamics?
Our Jet suite of software is your go-to for Microsoft Dynamics data visualizations and dashboards. Jet Analyticsis a worry-free data warehouse automation system that prepares, models, and warehouses your data. Jet Reportsis an Excel-native visualization tool to create interactive dashboards directly from your ERP and other data sources. These work together to simplify data integration, quickly producing reports based on real-time data. Any user (including those with minimal technical experience) can create beautiful and insightful dashboards with filters, web-based sharing, integration with Power BI, and more.
How can I create a business dashboard in Excel?
While Excel’s interface is familiar to most business users, manually building and maintaining complex dashboards (especially those with real-time data) can be tedious and difficult. Microsoft does offer some very basic templates, but these don’t cut it for larger businesses. Jet Reports is an add-on for Excel that revolutionizes this, turning your familiar spreadsheets into an intuitive BI front-end that pulls live data, refreshes all tables, charts, and KPIs with one click, and has extensive drill-down capabilities. This way, you can create effective business dashboards directly in Excel, combined with the powerful automation and governance of a modern BI tool.
How can I create a business dashboard for Qlik?
Although Qlik is an effective tool, Vizlib provides an additional layer to enhance and extend the capabilities of its dashboards and visualizations. Start by installing the extensions within your Qlik environment, then decide which Vizlib tools you want to try out. Vizlib Table creates interactive tables with dynamic features, while Vizlib Filter adds intuitive and customizable filters for enhanced data exploration. Other features include pre-built templates for consistent designs across your dashboards, Vizlib Actions to automate tasks, Vizlib Button to create shortcuts, and much more.
Can I share my dashboards with others in my team?
Absolutely! insightsoftware dashboards are designed for collaboration, so you can easily share them with colleagues and grant them different access levels, depending on their needs. Dashboards can also be exported as PDFs, PowerPoints, or Excel files and sent via automated email distributions to stakeholders.
How can I ensure my dashboards are always up to date with the latest data?
Our solutions offer automated data refresh capabilities. You can schedule dashboards to update at regular intervals (or when an event, such as a new transaction, triggers), so your team is always working with the most current information.
Why choose insightsoftware for your business dashboards?
Our deep and secure integration with leading ERPs and CRMs makes data transfer a breeze, while no-code interfaces empower departments across the organization to build insights without IT bottlenecks. The extensive catalogue of pre-built templates spans a variety of business types and industries, so you can find the perfect fit without building one from scratch. Lastly, all of our platforms are designed with security and governance at their core to ensure compliance, perfect for regulated industries.
What are the best insightsoftware platforms for creating business dashboards?
Our suite of software offers several options for creating dashboards, depending on your data sources and preferences. Jet Reportsis fantastic for Microsoft Dynamics data and works right in Excel, while Vizlibis a standout for supercharging Qlik environments with new functionality and customization. For those looking for embedded analytics, Logi Symphonyhelps build highly tailored dashboards for embedding in web apps or software platforms.
What security features do insightsoftware dashboards offer?
Our dashboards offer robust security features to ensure your sensitive information is always protected, including role-based access control and data encryption. Beyond these, all of our major platforms integrate directly with Microsoft Entra ID and can use single sign-on to eliminate risky password sharing. Audit trails track when users log in, view, edit, or export dashboards, so you have complete transparency for regulatory compliance, internal governance, and more.
Can I customize my dashboards to specific user preferences?
Our dashboard solutions allow you to tailor reports based on user roles, departments, and technical skill levels. With this, you can create custom experiences that offer the right depth and visualization types for each user’s unique requirements. This includes personalized views, saved KPIs, alerts, and much more. Contact our team to see which platform is right for you.
Can I integrate my dashboards into existing applications and workflows?
What kind of flexibility do I have when building dashboards?
Our software redefines flexibility, empowering you to customize every aspect and build dashboards exactly as you envision. Incorporate a wide range of data sources, visualizations, and drill-down features. You’ll never be boxed in with insightsoftware; create dashboards that adapt to your evolving business needs and deliver powerful insights your way.
Can I incorporate AI into my dashboards for more advanced insights?
Our platforms integrate seamlessly with AI and machine learning models, enabling predictive analytics, trend forecasting, and automated insights. Leverage these advanced capabilities to uncover hidden patterns, identify key opportunities, and make data-driven decisions with greater precision. Learn more about Logi AI here.