Create powerful financial presentations directly from Excel
"*" indicates required fields
See for yourself why over 500K+ users are using insightsoftware


Do you struggle to translate Excel data and analysis into compelling presentations?
Excel reports and visualizations are not presentation-ready
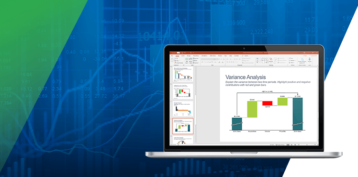
Using Excel output is limiting the effectiveness of your financial presentations. Excel visuals are designed for sharing data, but they are not ideal for presenting insights.
You spend too much time producing presentations
Manually exporting, formatting, and preparing data is not only an inefficient use of your resources; it poses a risk to data accuracy and decision making.
Financial presentations are disconnected from verified data
When sharing financial presentations, you need to worry about data accuracy. When the data changes, you need to make manual updates.
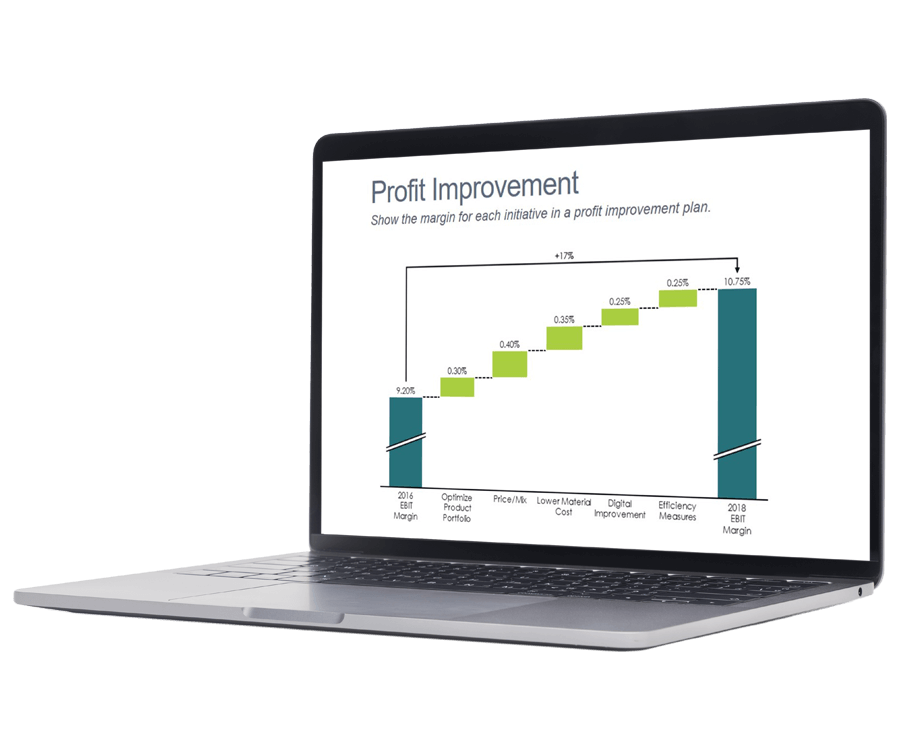
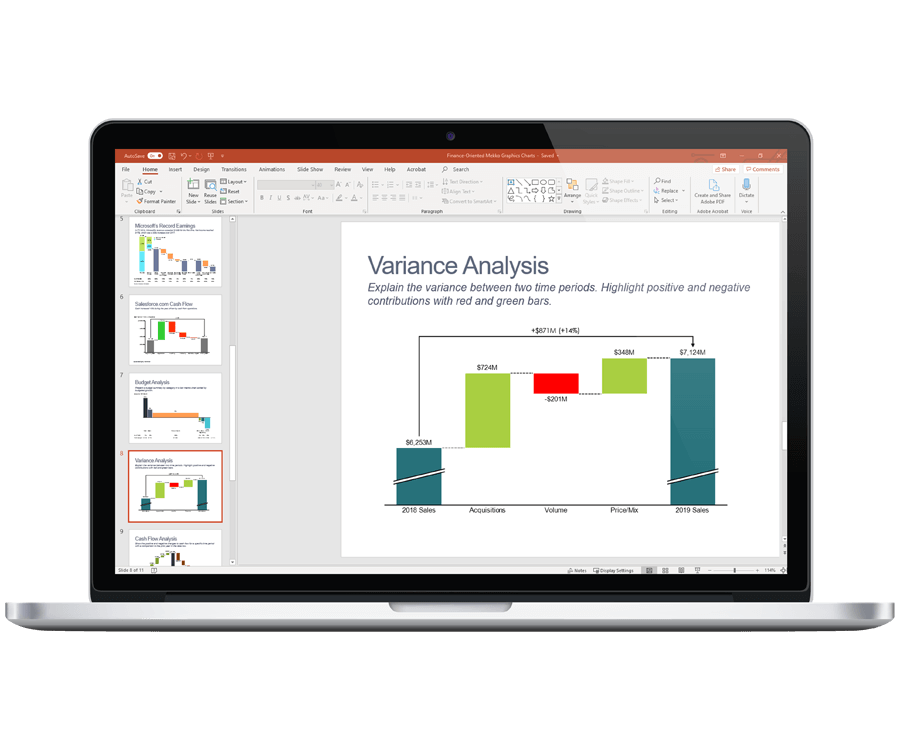
Craft a compelling story
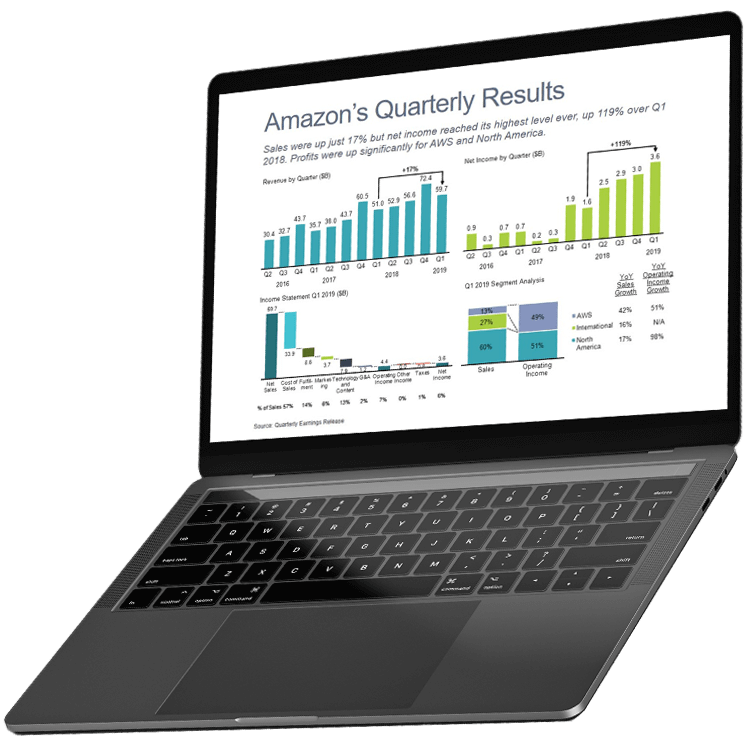
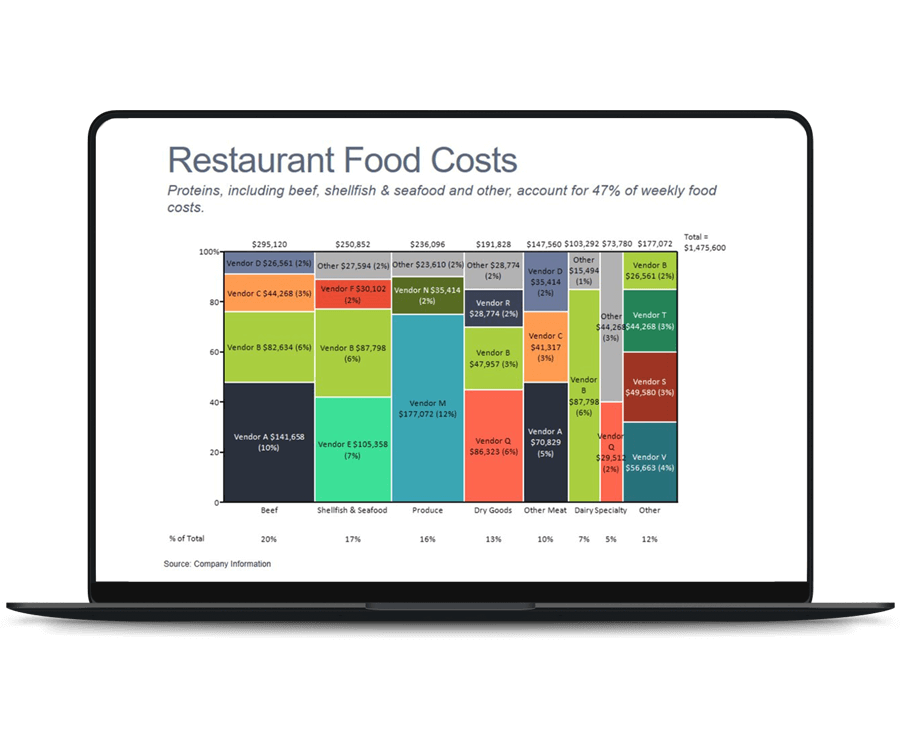
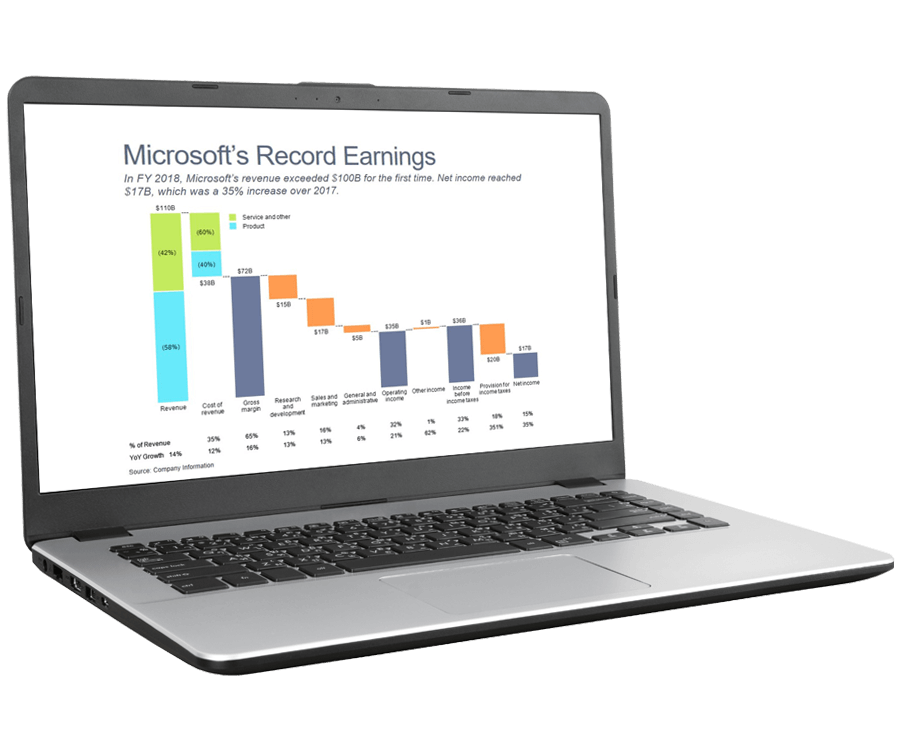
Create charts with analytical enhancements to emphasize insights. Make financial analysis accessible by sharing simple, but insightful presentations with non-finance users.
Reduce chart and presentation production time
Set your formatting preferences and custom branding and apply to all presentations. Simplify your charts without altering the underlying data. Save charts and slides in the gallery for easy re-use.
Connect to accurate data
Generate dynamic charts in Excel or PowerPoint that are linked to verified Excel data and update automatically when data changes. Say goodbye to static, outdated charts.
Get up and running fast
Install the PowerPoint and Excel add-ins in just minutes without any assistance from IT. On-demand training resources help you learn at your pace.
Top 10 Financial Charts with PowerPoint Add-in: Mekko Graphics
Meet the newest member of the insightsoftware family: Mekko Graphics. The industry leader in elevating basic charts from Excel or PowerPoint into compelling charts that tell your financial story.
Join us for a 20-minute demo to see 10 top financial charts in a whole new way. You’ll learn how to visualize your income statement and present cash flow analysis to better explain the issues and identify opportunities. The Mekko Graphics add-in for Excel and PowerPoint is particularly useful for people who spend time translating data and analysis into slide decks for large presentations or board meetings.
Key Takeaways:
- How to present financial results and recommendations from financial analyses
- Guiding your audience to insights using analytical enhancements
- Tips and best practices for using each of the 10 financial charts
Work with the #1 Reporting Solution Vendor Worldwide

We now have the ability to take our planning process and distribute it out to the edges of the organization to bring more people along with us.

Request Pricing
Related Resources