Finance-Owned and Managed Excel-Based Reporting for FIS
Take Control of Your FIS Reporting Process
Stop Relying on Static Spreadsheets for Your Most Complex Reports
When you want to get away from supporting your most complex reporting needs by creating spreadsheets that stitch together multiple data sets, yet are disconnected from your core FIS data, with no ability to refresh with the latest data.
Put an End to Repetitive, Manual, Daily Reporting Tasks
When you want to get away from the repetitive, time-consuming download, rekeying, and reformatting of data in Excel to complete your daily reporting.
Save Time on Data Analysis
When you want to be able to drill into the detail from in Excel to spot anomalies and find the root cause in your FIS data.
Trusted By


Empower Finance Teams to Create Their Own Reports
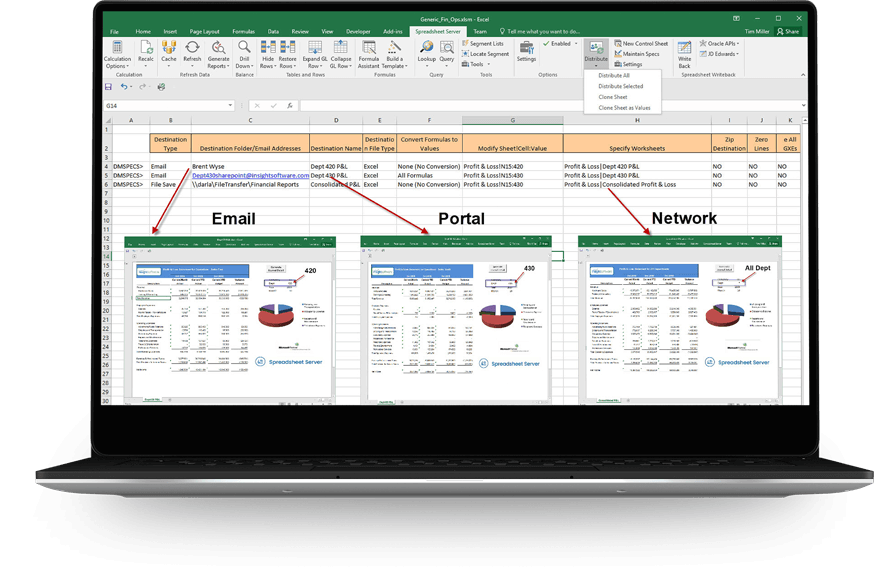
Enable finance teams to create reports in their tool of choice, Excel, without relying on IT help. Simplify the production of daily, weekly, and quarterly reports (e.g., branch profitability reports, average balance sheet, number and types of accounts originated, non-interest income by product, weighted average maturities, etc.). Create reports once, then refresh with parameters to create views by business line, branch, product, officer, etc.
Speed Up Analysis with Fast, Flexible Reporting
Simplify analysis for all stakeholders by enabling them to drill down through books of loans and deposits into application data to find and fix integrity and reconciliation issues. Easily create the roll-ups and groupings you need to report your desired account structures, giving you the flexibility to view your data exactly how you need to see them.
Simplify Your Most Complex, Multi-Source Reports
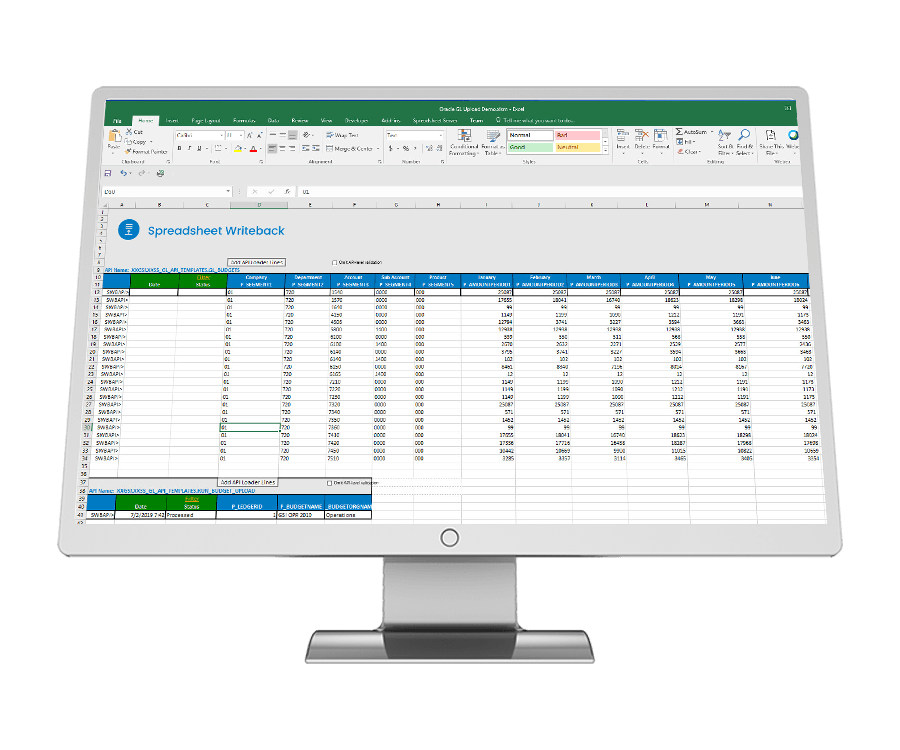
Save time and avoid rekeying in spreadsheets by automatically pulling together data from multiple sources (e.g., loans, deposits, non-interest income) to simplify the creation of some of your most complex reports (e.g., the Quarterly Call Report).
View Recommended Products
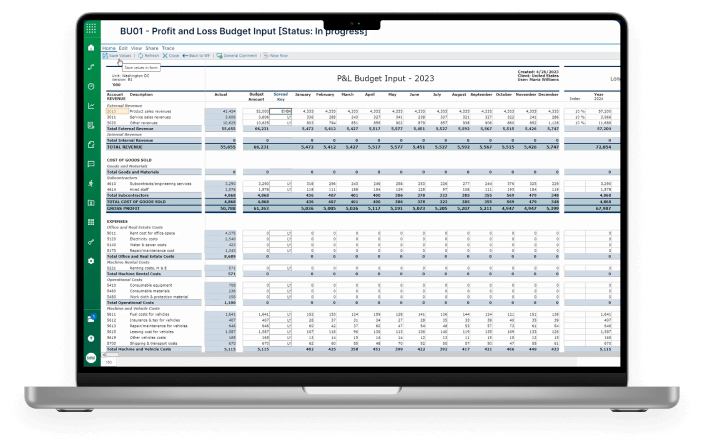
Bizview
Fast, integrated, web-based budgeting, planning and forecasting designed for growing mid-sized businesses needing a scalable solution.
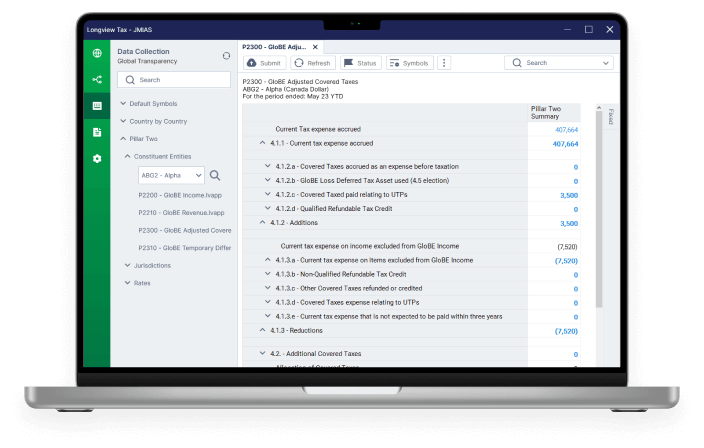
Longview Tax
Flexible, cloud-based corporate tax software that improves the tax function across companies, designed for large entities with complex needs in foreign exchange or complex organizational structures headquartered in North America, EMEA or elsewhere.
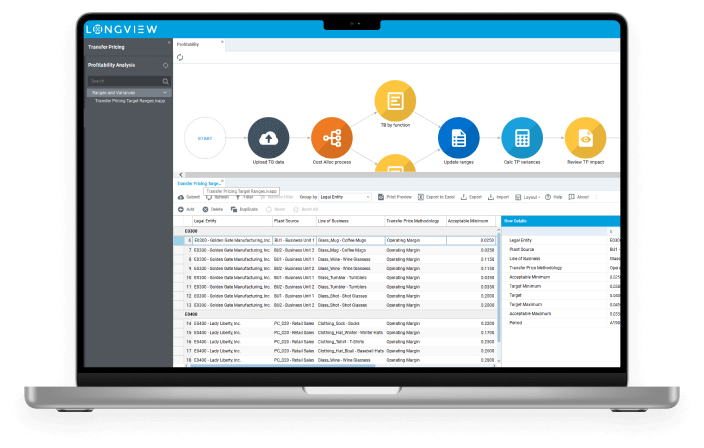
Longview Transfer Pricing
Navigating changes to supply chains and global tax regulations is a challenge. Longview Transfer Pricing boosts visibility and compliance posture.
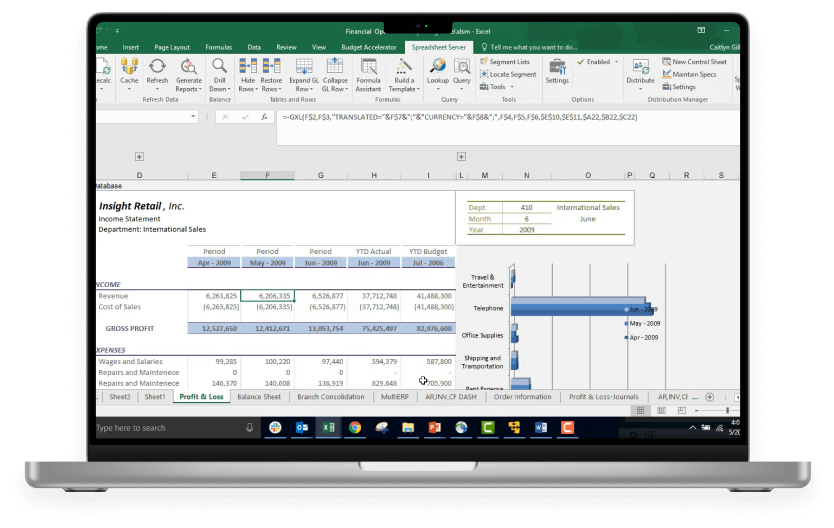
Spreadsheet Server
Real-Time Reporting that Connects to 140+ ERPs Directly in Excel
How to Compare Reporting & BI Solutions
Reporting and Business Intelligence (BI) solutions begin and end with data—not just how the data are collected, but also how they are stored, organized, and accessed. With a saturated market full of solutions to choose from, you need to have a clear understanding of your data needs before you start comparing your options.
In this white paper, you will learn:
- What to look for in reporting and/or BI software.
- Why a reporting and BI solution is essential for growth
- How to avoid reporting and BI solution implementation failure
To assist with your software selection process and help you find a solution that fits your current ERP system and IT infrastructure, we have also created a framework for evaluating third party solutions.
You need to have a clear understanding of your data needs before you start comparing your options.
Work with the #1 Reporting Vendor for FIS
"Spreadsheet Server allows me to create custom reports that are also highly interactive, making for a powerful analytical tool!"
Speak to an Expert