Novo Nordisk leverages the customisability of Qlik + Vizlib to meet line of business requests and drive user adoption

Novo Nordisk is a leading pharmaceutical company based in Copenhagen – discovering, developing and delivering innovative medicines and delivery systems for those living with serious chronic disease.
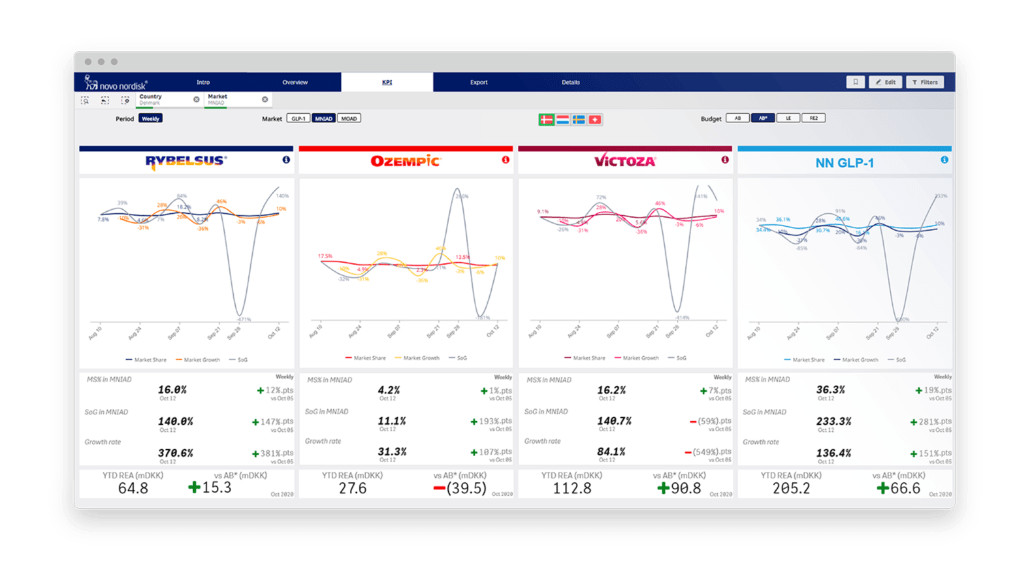
Through the support of user-friendly data analytics solutions, such as Qlik Sense, the organisation ensures optimum levels of innovation, commercial excellence and continual improvement.
To hear more about how they deliver effective, fit-for-purpose analytics and drive user adoption, we spoke to Metti Mahdizadeh, a BI Business Analyst at Novo Nordisk.
The analytics tussle – moving from QlikView to Qlik Sense
Novo Nordisk was initially working with QlikView, before migrating to Qlik Sense in 2017. But many of the users felt that with the switch, they lost much of the native capability. Qlik Sense didn’t provide them with all the functionality and customisation they needed as a business.
And though Metti was promoting the use of Qlik Sense – it wasn’t an easy job, initially! Without the additional features included in QlikView, the team didn’t feel their analytics needs were being met. “If you work with QlikView, it is quite feature-rich, but it’s also complicated. The first versions of Qlik Sense felt like they preceded QlikView. It missed a lot of vital, basic features,” Metti shared.
According to Metti, even the latest versions of Qlik Sense did not deliver exactly what the users sought. The finance team, for instance, wanted to include specific fonts, colours and other high levels of detail. And that’s when he realised there were enhancements for Qlik Sense that could fulfil their requirements.
Using Qlik + Vizlib to boost user adoption
At Novo Nordisk, they use Qlik Sense for international operations, sales and finance predominantly. But these teams required something beyond native Qlik Sense capabilities.
The turning point for the finance team was when they realised that with Qlik Sense + Vizlib, they could get the customisation they wanted! They were initially using very detailed Excel templates, but when the BI team managed to replicate those exact specs with Vizlib Table, the finance team were on board!
They also wanted more automation of their financial processes. “And this only works if they can get the same thing they’re used to seeing. Like the layout—having the exact same view they’re used to. It becomes quite handy with Vizlib!” Metti added.
“And this is where the journey started because once the finance people started using it more and more, the other teams became interested in using Qlik Sense and Vizlib,” Metti continued. “…because you could create more layouts and modification, and make the visualisation or report more attractive.”
And, as Metti reiterated, presentation is everything, especially since the decision-makers in any organisation are not necessarily highly technical people. The more dataviz wow they see, the easier the decision!
As the momentum of business-user adoption grew, it wasn’t long before the highly skilled users—the analysts, were also on board with Qlik Sense and the Qlik community in the company grew rapidly.
Catering to more use cases with Vizlib
When you’re promoting BI solutions, it’s often to people that are using basic products. And they’ve likely been using the same products, such as MS PowerPoint or Excel, for many years. Then you come along and suggest that, “now you can use other tools that are smarter,” Metti adds, “But often they need some feature they used to have.” And that’s where Metti was proactive and realised: “If we include Vizlib’s products, it will help us to expand.”
Vizlib’s added customisation for Qlik Sense facilitates more line of business requests
“Before Vizlib, people asked for something and I had to say no. But now, when they come with unusual requests for the layout, for instance, I’m sure I can achieve it with Vizlib. It gave me the confidence for these line of business requests.”
More customization with Vizlib Library
- Vizlib Filter
Since the Novo Nordisk users wanted the same features they’d had in QlikView, the native Qlik Sense functionality—with only one filter option—was not sufficient. But Vizlib Filter was able to re-introduce additional choices and customisation for these users.
- Vizlib Table
According to Metti, his favourite Vizlib Library extension is Vizlib Table. “Everyone wants tables. And I haven’t seen any extension as customisable as Vizlib Table,” he adds. As a result, Vizlib Table was key in driving Qlik Sense adoption in the organisation.
- Vizlib Line Chart
Their Finance team leverages Vizlib Line Chart for root cause analysis and forecasting. Metti shared an example. “For instance, with Covid, sales in China went down because they had to shut down some factories. And they wanted to do their budgeting to see how to assign the budget for the full year. So we could use the Vizlib Line Chart,” he explained. “It looks much more visual than the native line chart. And we created scenarios so they could change their numbers and adjust the sales numbers – to see how they can predict and decide where their budget should land at the end of the year. And what the trend would look like.”
With Vizlib Line Chart’s advanced analytics capability, the team is able to plan more accurately during uncertain times

Getting the data ‘under the hood’ with Vizlib Self-Service
Custom Report in Vizlib Self-Service became a helpful tool for exploring the data behind the visualizations. “Rather than creating a table with buttons that show which dimensions and measures are visible,” Metti added, “Custom Report made it much easier to build a default data set and tell people, if you want to load the data or export it for further analysis that’s not on the dashboard – use Custom Report.”
At Novo Nordisk, we try to provide the best BI solutions for our employees, where it can give them valuable insights into their data. Vizlib has provided us with the ability to promote advanced visual analytics as well as self-service application development. During our journey, we had great support from Vizlib both on adding new features based on our needs and also fixing bugs.