Success story: Novartis drives Qlik user adoption with Vizlib


Novartis is a leading global healthcare company based in Switzerland. At Novartis, their drive is to reimagine medicine to improve and extend people’s lives, and address society’s challenging healthcare issues through innovation.
With over 100 000 employees scattered across the globe, Novartis relies on technology and analytics to continually improve efficiency, operational excellence and deliver more value.
To learn more about their passion for all things analytics and data visualisation, we spoke to Pierre-Louis Usselmann, the Visual Analytics Technology Strategy & Innovation Lead at Novartis.
Balancing app customisation with performance
At Novartis, they don’t do anything by half measures. When it comes to digital and data solutions, they’re all in and know just the right place to start—the users. Ensuring the users’ needs are met is always their top priority. By following a human-centred approach to analytics, these digital champions achieve just that.
“We have over 30 000 Qlik users,” Pierre-Louis estimates, “and the most important factor that’s driving adoption is user experience,” he continues.
To deliver user experience (UX) excellence, analytics solutions need to balance design, customisation and response time. When this state is achieved, it elevates the user experience to a new level, because, “it’s not reduced to UI, but rather focuses on the user journey,” Pierre-Louis adds. With this leading approach, Novartis empowers their users to take actions that result in effective business decisions. And generate more value for not only their users, but society as a whole.
Improving the user experience with Qlik + Vizlib
Effective UX begins with good design and the ability to customise data visualisations to a specific audience. Hooking your audience or end-user with eye-catching design as well as intuitive operability is the first step in a successful user data journey.
Novartis’ extensive Qlik user base utilises both guided and self-service environments to produce more than 1500 applications per month. To ensure these users connect with and feel confident to explore their data, the organisation favours innovative solutions that go beyond native Qlik Sense capabilities.
With their growing focus on UI, their UX teams are dedicated to creating and customising dashboards to meet UX design standards. And one way they achieve this is by choosing solutions that add more visual power to Qlik Sense.
Of the approximate 1500 apps created monthly, “about 60-70% contain Vizlib’s value-added products,” Pierre-Louis reckons. “More than 15 000 users are consuming an app containing a Vizlib solution.”
Adding design spark with Vizlib’s value-added products for Qlik Sense
To add the necessary level of customisation and design for an organisation embarking on a digital revolution, their UX teams leverage Qlik + Vizlib. Pierre-Louis adds, “We show our UX teams all the visualisation capabilities that our delivery team is supporting by comparing native vs an extension from a Qlik vendor. And in most of the cases, we are comparing native with Vizlib.”
He continues, “Those guys have their methodology, tricky designs and prototyping. And today the only way to get close to what they propose for the business is by leveraging Vizlib’s solutions.”
Outshining native capabilities with Vizlib KPI Designer
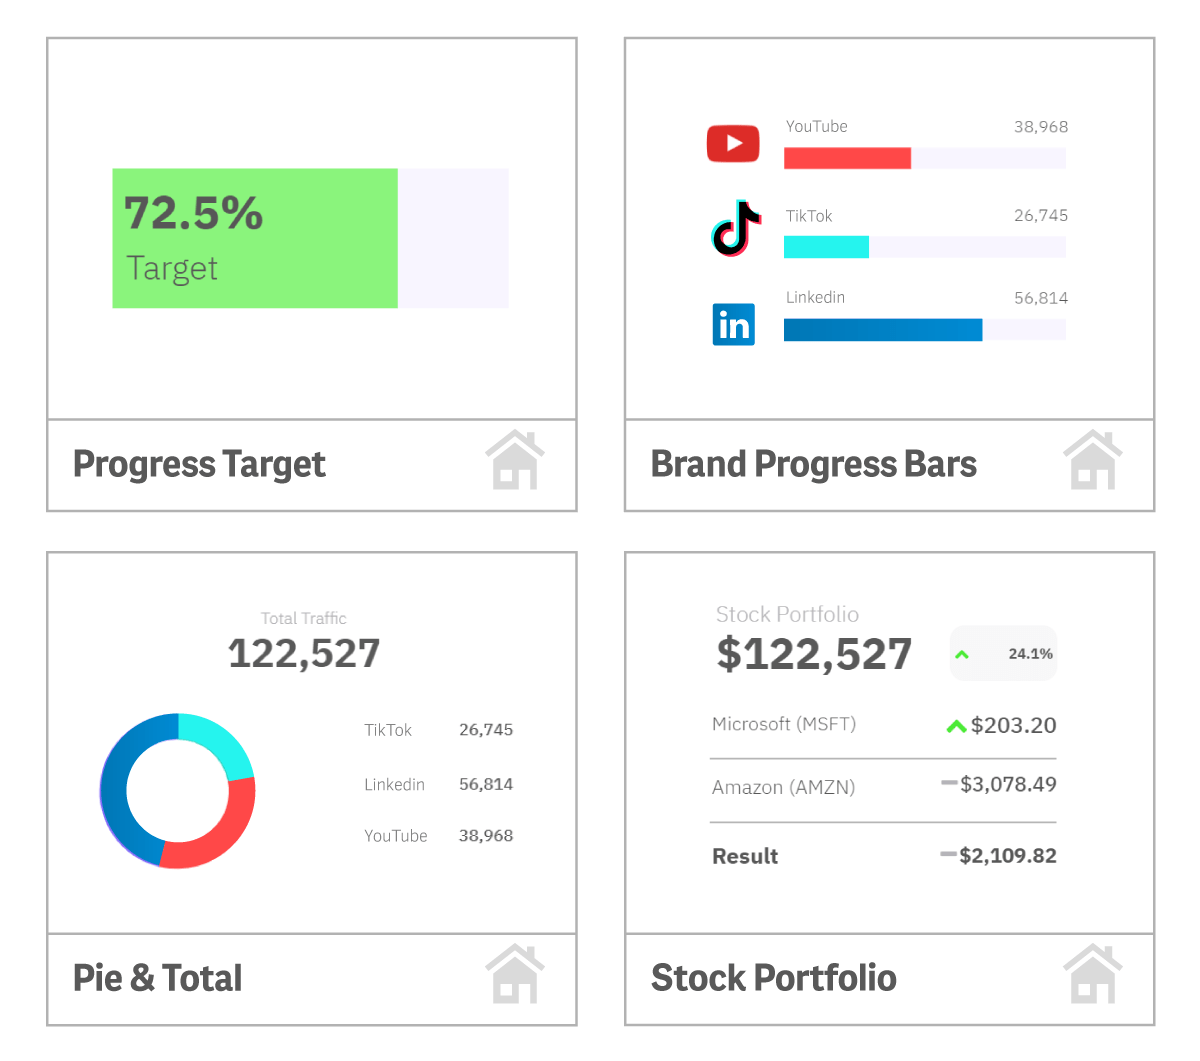
Vizlib KPI Designer adds more visual impact to KPIs. And, “it’s a really great way of presenting data,” Pierre-Louis affirms.
Users can add visual layers such as charts, images or icons with Vizlib KPI Designer to create impactful KPIs.
Creating reports independently with Vizlib Self-Service
At Novartis, they have approximately 1000 self-service business users working with Qlik Sense. And for Pierre-Louis and his team of 5, it’s not possible to provide such a large cohort with all the training and support they might need. However, with Vizlib Self-Service, these users are able to create dashboards and reports from scratch in Qlik Sense without any technical support.
“KPI Designer is our number one Vizlib product at Novartis, within the entire Vizlib Library. It’s day and night compared to the native KPI object.”
