Success story: First Quartile Consulting saves 200-hours of resource time with Vizlib

First Quartile Consulting is a utility consulting firm that offers consulting and benchmarking services to help its clients achieve measurable performance improvements.
Their goal is to be the pre-eminent provider of consulting and benchmarking services, delivering results through responsiveness to client’s needs and interests while providing intellectual leadership in performance improvement.
One of the many valuable services First Quartile Consulting provides is the Public Utility Benchmarking report – an annual study, whereby utility companies across the USA supply data that feeds into the report, enabling measurement and assessment against peer organisations within the sector.
The consultants provide value-add insights back to the utility companies, helping to identify where improvements and efficiencies can be made against their competitors.
First Quartile Consulting’s journey with Vizlib
- Moving to an innovative solution with Qlik Sense
- Realising the benefits of data visualisation
- Transforming the production process with Qlik + Vizlib
- Future plans with Vizlib
Moving to an innovative solution with Qlik Sense
The annual report benchmarks 40 companies. First Quartile Consulting has been producing this highly-regarded report for a number of years, trialling a number of different approaches.
Prior to the integration of Qlik Sense and Vizlib, First Quartile Consulting had, for 10 years, been using its own custom-built software, designed to support the creation of this report. They had reached a point where the benefits of having their own custom software was outweighed by the challenges of maintenance and upgrades to keep pace with client’s demands.
They were looking for a solution that offered innovative and constantly evolving features that would allow them to increase the focus on improving its value-add services and insights, rather than time spent on the production of the report.
The team approached a third-party consultant to identify the best solution to solve their business challenges. Following a review of the leading data analytics providers, it was agreed that Qlik Sense was the best all-round solution and the only one that offered Nprinting, a key catalyst for the team’s decision.
Realising the benefits of data visualisation
After a successful implementation in September 2019 and using Qlik Sense for the first version of the 2020 report, the team quickly identified a need for powerful data visualisation capabilities, in particular, colour formatting of the bars to indicate the company the data related to.
With 40+ companies benchmarked in the report and thousands of pages, being able to quickly and easily identify a company and the relevant data was becoming a business-critical issue, not only for First Quartile Consulting but also the clients that received the report.
The team reached out to the Qlik forums in search of an answer and discovered that Vizlib could help to solve their challenges. Following support from Qlik Sense and then subsequently Vizlib, the team were quickly up to speed and using Vizlib Library, improving the ease in identifying each company’s dataset and reading the data.
Transforming the production process with Qlik + Vizlib
As well as solving the issue of colour formatting the bars, the team have realised significant resource savings and improvements in the production process leading to additional time that can be spent on value-add services for its clients.
As part of its service offering, once the data was gathered, First Quartile Consulting reported back with a customised presentation for each company, drawing conclusions and analysis of the company-specific data.
Prior to the implementation of Qlik Sense and Vizlib this was a manual process, whereby a dedicated resource would manually go through each template PowerPoint and pinpoint arrows on the company-specific data and highlight areas of data that was relevant to that client.
Upon implementation of Vizlib, the need for this time-intensive resource was immediately eliminated. This not only freed up this team member to focus on drawing analysis and insight, which offers significantly more value-add to the clients, but it also wiped out 200-hours over a 3-month period. In addition to the time-saved, it radically changed the production process.
No longer did the team have to wait 5-weeks for the set of company presentations to be completed, it could now be done within 48 hours.
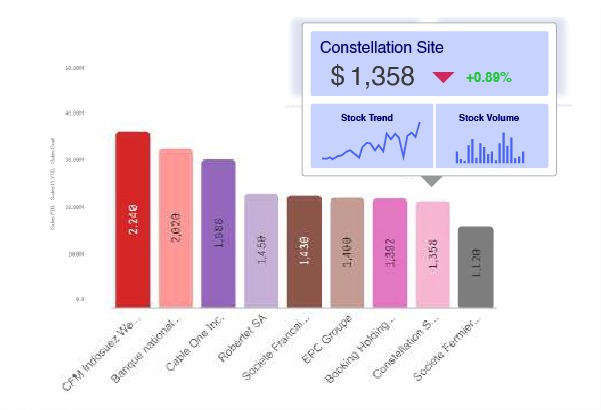
Further benefits realised by the team: Viewing the value above the Vizlib Bar Chart rather than the client relying on the axis to interpret the data. This possibility in stacked as well as standard bar charts created a significant improvement for the display of data in the report.
Future plans with Vizlib
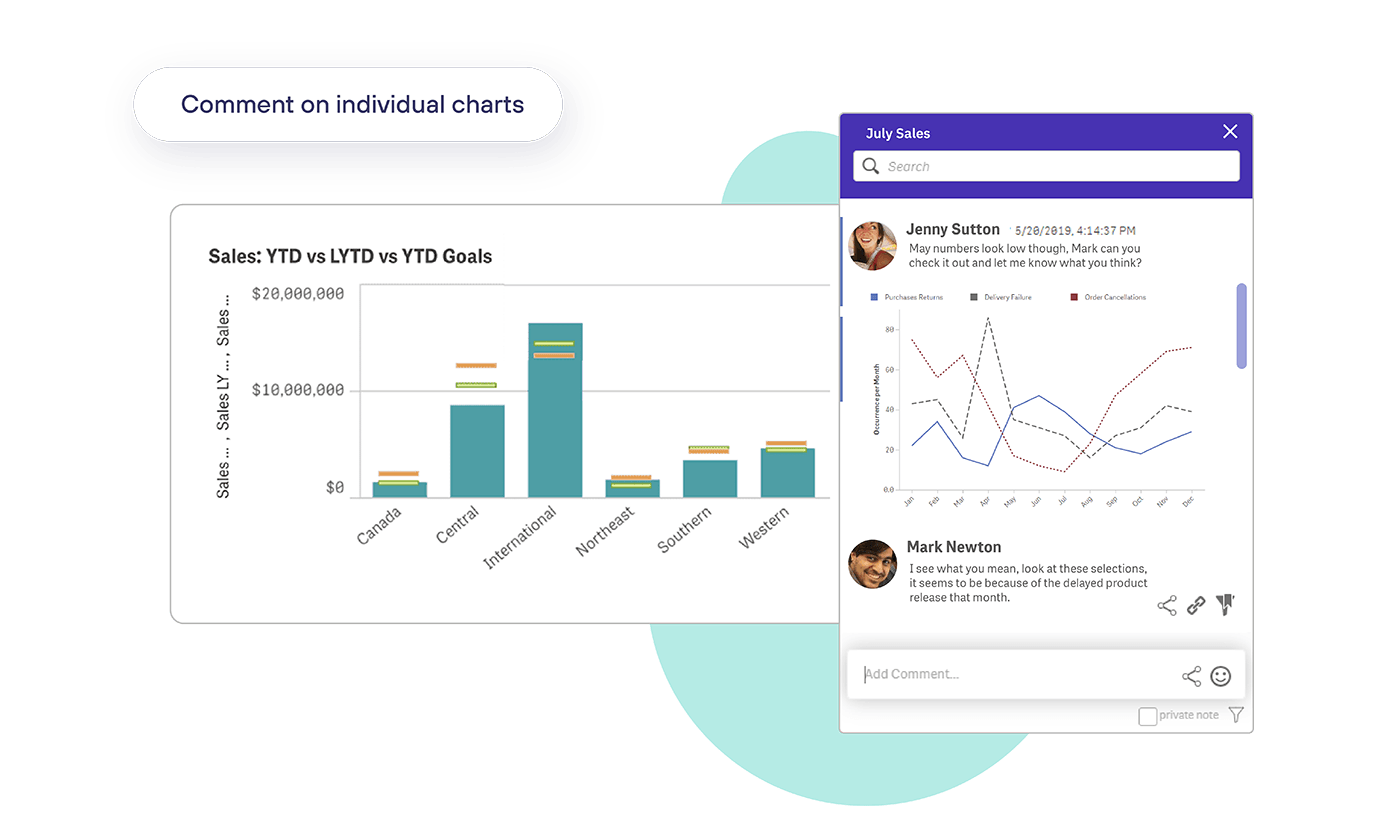
In the near future the team are planning to use Vizlib’s writeback capability to correct ‘bad’ data within a client’s Excel report, and Vizlib Teamwork, a practical collaboration tool for their team to provide transparency and improve efficiency when working on shared files.
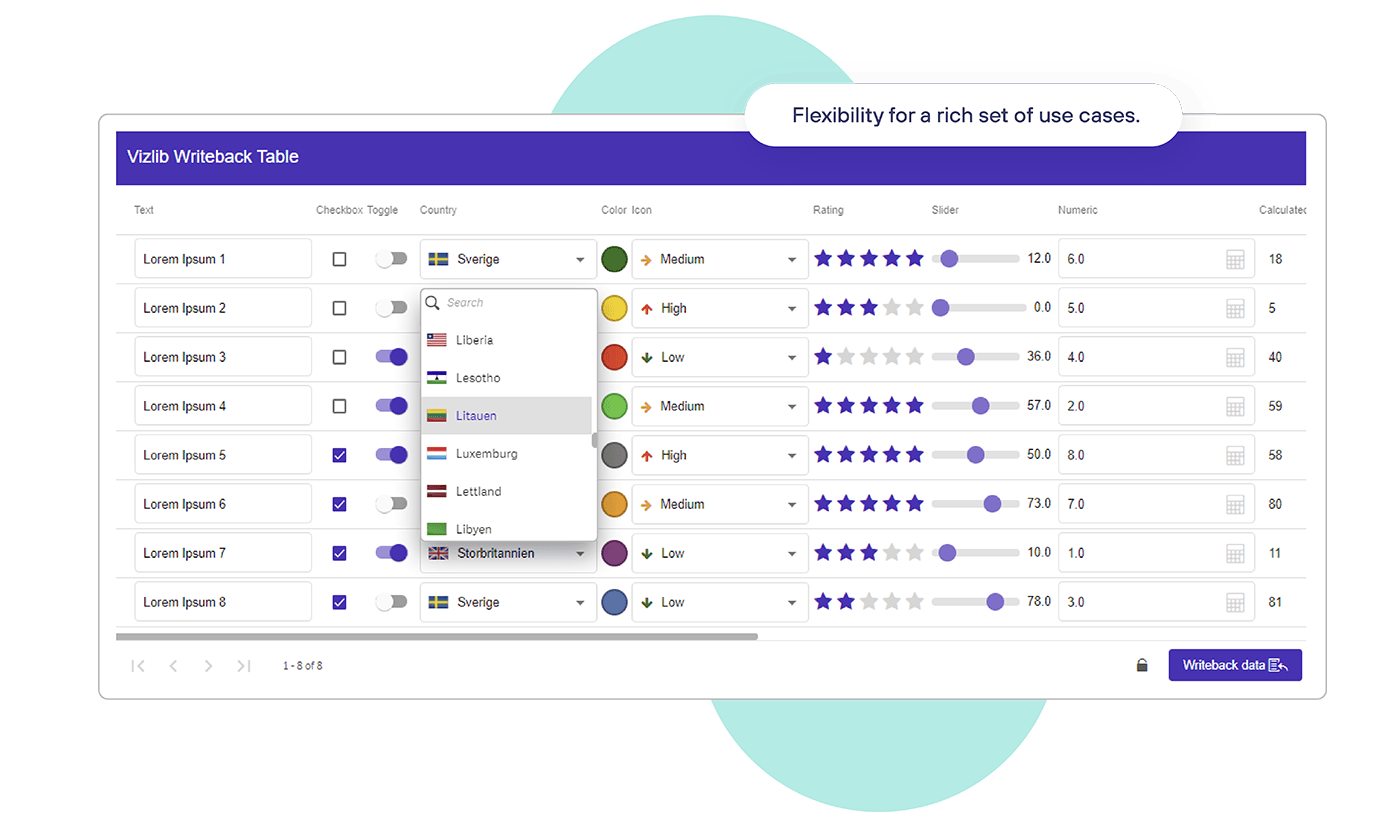
“There are many times when compiling this report that I can see a company has supplied inaccurate data.” Debi Cook comments, “To be able to correct this, put it back into their Excel file and send it back to them to use moving forward will be invaluable to us and our clients.”
Cook continues, “Vizlib Collaboration will help us to move away from manually marking up PowerPoint files with the changes that need to be made. It will mean we can easily share and work on changes within the documents, improving the efficiency of the team and the accuracy of the information we present to our clients.”
“Using Vizlib and Qlik Sense has made a huge difference to the process we go through in compiling the report. I love that Vizlib is always making improvements and adding new features and functions which have a big impact on my day-to-day work, as well as planning for our future reports.”