Save Time and Improve the Accuracy of Your NetSuite Reporting

Financial and operational reporting for NetSuite can be a challenge. As is the case with many ERP systems, NetSuite’s reporting capabilities tend to be somewhat restrictive. It can be difficult to pull information from multiple NetSuite modules into a single, cohesive report. In other instances, information for which there ought to be a fairly straightforward reporting process turns out to be inaccessible. For example, NetSuite allows for hierarchical customer relationships, but its native reporting capabilities cannot adequately display those relationships.
Third-party tools can give NetSuite customers greater flexibility, making it possible for them to design custom reports that go far beyond NetSuite off-the-shelf capabilities. Unfortunately, many of those reporting tools require advanced technical skills. If you don’t have a team of software developers on call, or if your IT staff typically has a backlog of work orders to fulfill, then you may end up waiting a long time to get the report you need. Even then, it might not be exactly what you asked for, in which case you have to go back to IT again and request additional changes.
All of that takes time and consumes scarce company resources that could be better used elsewhere in the organization. But what if you could have the best of both worlds? What if you could equip your finance team with reporting tools that allow for maximum flexibility, but also empower them to work independently, getting exactly what they need without always having to rely on programmers and database experts from the IT department?
Spreadsheet Server from insightsoftware enables finance teams to build NetSuite reports directly inside Microsoft Excel, accessing up-to-date ERP information. Instead of resorting to the usual process of extracting information from NetSuite and then importing it (or copying and pasting it) into Excel, Spreadsheet Server brings NetSuite data to your finance users directly within the tool they know and love, Microsoft Excel. You can refresh the information at any time, giving you an up-to-date view of the information in NetSuite.
Spreadsheet Server gives your accounting team ultimate flexibility for NetSuite reporting, without all the dependencies usually associated with sophisticated reporting or analytics tools. Here’s how it works:
How to Add NetSuite Data to Excel with Spreadsheet Server
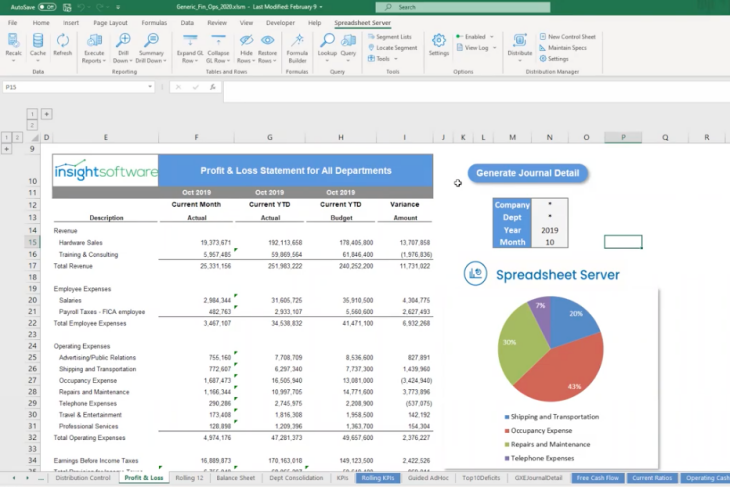
Imagine that you are building a standard profit and loss (P&L) statement with four columns: Current Month Actual, Year-to-Date Actual, Year-to-Date Budget, and Budget/Actual Variance. You can build out that kind of report fairly easily in Excel, but if you’re working with static data that you exported from your ERP system, it can take quite a lot of time to format them, make sure everything is in the right place, and double-check to make sure your totals are correct.
Now consider a different way of accessing those numbers. Imagine that you have the ability to add a formula to your spreadsheet that effectively says something like this: “Go get me the year-to-date total for all of the ‘Training and Consulting’ revenue accounts for December of 2019, and display that value in this cell.”
Let’s suppose that you also want to quickly and easily change your view of the report so that all the cells in that column display values for a different month and year, for example, February of 2020.
With Spreadsheet Server, that’s easy to do. Most Excel users are familiar with the concept of “parameters” (also called “arguments”) within a formula. For example, when you use the “COUNTIF” function in Excel, you must specify a condition that must be true in order to include a cell in the resulting count. For example, COUNTIF(A1:A100, “>0”) would return a count of all cells within the specified range that contain a value greater than zero.
Instead of hard-coding the parameter (in this case “>0”), you could reference a value in a separate cell. That way, you can change the results of your COUNTIF formula simply by changing the cutoff value in that cell. Most power-users of Excel have applied this trick on multiple occasions. It’s a huge time saver, and it brings a great deal of flexibility to your spreadsheets.
Spreadsheet Server allows you to apply this concept of parameters to a P&L statement (or to any report, for that matter). Expanding upon the previous example, you can build a formula using Spreadsheet Server that includes a parameter value for the month and year. In other words, you could write your formula to say something like this: “Go get me the year-to-date total for all of the ‘Training and Consulting’ revenue accounts for [MONTH] of [YEAR], and display that value in this cell.” By referencing “month” and “year” values stored elsewhere within the same worksheet, you make it easy to update the report to display any given month and year, simply by changing the values in those two cells.
In the example below, you see a P&L statement for December of 2019. If you change cell N14 to “2020” and cell N15 to “2,” the report will be updated to display February 2020 data. To show a different month and/or a different year, you could simply change those values to something else, and all of the values in the worksheet would be updated automatically to reflect the new selection. It’s that simple.
Spreadsheet Server goes far beyond simply providing you with pre-defined formulas for accessing your NetSuite data, though. With Spreadsheet Server’s Query Builder and Formula Builder, you can take your Excel-based ERP reports to a new level by inventing entirely new ways of organizing your ERP data, including combining data from multiple NetSuite modules. You can make that information available in Excel with your own custom formulas. What’s even better is the fact that you don’t even need to be a programmer to do it.
Building NetSuite Queries
To understand how the process works, let’s look at the concept of queries. A query is a request to the database for information that meets a specific set of conditions. If you want a list of customers with an open balance, you could write a simple query that gives you the customer name, phone number, and balance due.
For an IT person, that might look something like this: “SELECT CUSTOMERS.COMPANYNAME as ‘Customer Name,’ CUSTOMERS.PHONE as ‘Phone,’ CUSTOMERS.OPENBALANCE as ‘Balance Due’ FROM CUSTOMERS” WHERE CUSTOMERS.OPENBALANCE <>0.”
That’s a very simple example, but it still requires considerably more technical expertise than most finance people have. The programming language shown here (Structured Query Language or “SQL” for short) can be cumbersome and unforgiving of errors. In fact, it can get much more complicated if you need to include information from multiple tables or modules. That kind of complexity makes for a steep learning curve, and it’s not the kind of thing that most finance people have time to handle. Finance teams need a simpler, more intuitive way of working with their ERP data, and that’s where Spreadsheet Server’s Query Designer comes into the mix.
With the Query Designer, virtually any Excel-savvy finance user can navigate NetSuite’s tables, find the information they need, and start building custom formulas that allow them to access their ERP data directly within Excel, in real time.
Query Designer provides a graphical view of NetSuite’s tables and enables a user to simply select the information they want, apply filter criteria, and save the resulting query so that you can use it to create custom formulas and reports in Excel. Query Designer also makes it possible to rename fields using names that intuitively make sense to other end-users in the finance department.
One of the most powerful features of Query Designer is the ability to add parameters. Parameters allow you to filter the information you want based on user input. Following on the previous example, if you would like to create formulas or lists in Excel that show customers with a balance greater than $1000, you could do that simply by adding a hard-coded value in the Query Builder.
You can achieve even more flexibility with Query Designer, though. Let’s say that a user wants to specify a cutoff value within their Excel formula, so that the information presented in Excel only shows customers with balances greater than the amount specified by the user at the time they run the report.
To do that, you could add the balance cutoff value as a parameter. In other words, you want the query to say “Give me a list of the customers who have a balance greater than [AMOUNT].” Later, when you use that query to create a custom Excel formula, you can allow users the flexibility to determine the cutoff amount at that time, as part of their formula.
With Query Designer, you can create as many queries as you like. They can serve as building blocks for your custom formulas in Excel. Each query provides a unique lens through which to view your NetSuite data. Every query can have its own unique way of slicing and filtering the data in your ERP system.
Using the Formula Builder
Many members of the finance team might never use the Query Designer at all, preferring instead to simply work with the queries that others have already created. In fact, Spreadsheet Server includes a comprehensive set of predefined formulas that address the most common NetSuite reporting requirements, so anyone can start building custom reports in Excel without ever using queries at all.
Whichever option you choose, you will find that the process of filtering and manipulating ERP information inside Excel is remarkably simple because of Spreadsheet Server’s Formula Builder.
With the Formula Builder, an Excel user starts by selecting the query they want to use (for example, you might have named the previous example “Customer Balances Query”). Next, the user specifies whether they want the results to appear as a single value within a cell (for example, a sum of balance due for all customers that owe more than $1000), or as a table (for example, a list of those customers and their respective account balances). Finally, they click “insert” and the formula is added to the Excel spreadsheet. It’s similar to using Excel’s chart wizard. There is no need to type a long and complicated string of arguments and parameters into Excel’s formula bar; Spreadsheet Server takes care of those details automatically.
Ultimate Flexibility in NetSuite Financial Reporting
Spreadsheet Server combines the ultimate flexibility of Excel with the depth and sophistication of a robust financial and operational reporting platform. As with all other products from insightsoftware, there is a heavy emphasis on ease of use. In everything we do, we aim to achieve that simplicity without sacrificing functionality. In this respect, Spreadsheet Server stands out as being fundamentally different from the off-the-shelf reporting tools that come with NetSuite or other ERP systems, and from the complicated BI platforms that require extensive training and a team of IT experts.
Unfortunately, the finance and accounting teams at many small and midsize companies live with cumbersome workarounds that result in a lot of wasted time and effort, as highly skilled personnel spend valuable hours every month manually copying and pasting information into Excel so that they can produce the reports they need. That can lead to errors whenever file formats change, when teams overlook certain data, or when teams manually enter values incorrectly.
Even worse, the information in the resulting reports is outdated as soon as you create the report. Updating the data requires that you perform part or all of the copy/paste processes again.
With Spreadsheet Server, you get the best of both worlds. You get the richness of an enterprise-grade reporting tool with the simplicity, flexibility, and familiarity of Microsoft Excel.
As a global leader in purpose-built ERP reporting solutions, insightsoftware has extensive experience in solving complex reporting and analytics challenges for NetSuite customers. Thousands of companies have turned to insightsoftware to help with reporting and analytics. We offer finance-owned reporting solutions that integrate with over 140 different ERP and CRM systems, including SAP, Oracle, Microsoft Dynamics, and Sage.
If your organization is seeking to improve your NetSuite reporting capabilities in the coming year, contact us to discuss your needs and arrange a free demo.

Related Resources