How to Track the Efficiency of Your Accounts Payable Processes

If the accounts department is the lungs of the enterprise, directing money (oxygen) in and out of the organization, it’s understandable that accounts receivable receives so much focus; without a consistent influx of cash, no company can survive for long. But just as inhaling and exhaling are equally important biologically, accounts payable plays a vital role in keeping an organization financially healthy.
Accounts payable requires ongoing attention, close tracking, and a constant commitment to improving outcomes. It’s easy to think that accounts payable is working optimally, but it’s always dangerous to assume that a core business process is somehow exempt from or immune to improvement. Everything can get better, and with so much about the future of the economy looking uncertain or alarming, everything must.
With accounts payable, as with all complex, continual processes, that means tracking key performance indicators (KPIs). To make this effort worthwhile, companies must limit their attention to the KPIs that speak the loudest about the strengths and weaknesses of the accounts payable process. Here are five you should be tracking to ensure optimal efficiency in your accounts payable processes.

1. Cost to Process an Invoice
The cost to process a single invoice can be significant after factoring in all data entry, routing, and follow-up communications. Companies often write this off as the “cost of doing business,” but small savings on a single invoice can add up to surprising sums over time. To calculate invoice processing costs, work with the AP department to estimate how much time they spend on an invoice, multiply that by the hourly labor costs, and add in hard costs like postage. Then divide by the number of invoices processed that month.
2. Time to Process an Invoice
At some companies, it takes close to a month to process an invoice and at others, it takes less than five days. Shrinking the average time to process an invoice takes multiple measures, but it starts by understanding present performance. To calculate this accounts payable KPI, keep a record of the date and time when the AP team receives each invoice next to a record of when the approval cycle completed. Whether this metric is trending up or down says a lot about the strength and sustainability of the AP team.
3. Accounts Payable Employee Efficiency
The number of invoices the average full-time employee can process on a monthly basis relates to a pair of issues: first, the labor costs associated with accounts payable, and second, the amount of time accounts department employees have to focus on issues besides invoice processing. Calculate efficiency by dividing the number of invoices processed each month by the number of employees. Count full-time employees as 1.0 and part-time employees as 0.5; an AP team might have 3.5 employees total.

4. Total Number of Touchpoints
In general, the more that accounts payable relies on paper documents and manual processes, the more touchpoints each invoice requires. In that way, this figure helps to illustrate the efficiency of AP generally because the more touchpoints there are, the slower an invoice moves through the organization and the higher the risk becomes for human errors. Track the number of touchpoints by creating a workflow chart that illustrates everywhere an invoice goes.
5. Invoice Exception Rate
Invoices deemed as exceptions because they contain errors or omissions affect all the other metrics on this list. Any invoice that deviates from the norm consumes more time, costs more money, requires more attention, and hits more touchpoints. Before AP teams can get a handle on this issue, they need to understand how prevalent it is and whether exceptions are trending up or down historically. Track the number of exceptions that happen each month, then divide that number by the total number of invoices and multiply the result by 100 to find out the exception rate by percentage.
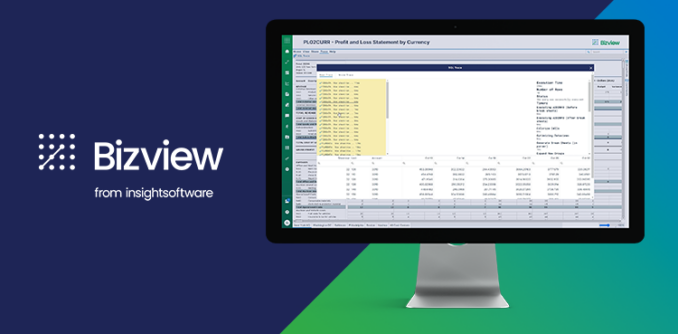
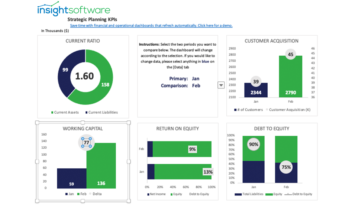
Dashboards are the best tool for tracking accounts payable KPIs because they put the information front and center while requiring little to no effort to update the KPIs. Financial reporting tools from insightsoftware enable you to quickly build the reports and dashboards you need to track the KPIs that matter most to you.
Request a free demo today that will help you unlock the power of the data that means the most to you.

Related Resources


25 Bizview Use Cases for Finance Pros

xP&A for Power BI