Power XL: Full Spreadsheet functionality in Power BI

“Excel & Power BI – Better Together” has been the punch line for many presentations. It’s not just a punch line anymore. It’s real.
From its inception, Microsoft had a vision for Power BI; that it would be not only a leading Business Intelligence (BI) tool, but a solid collaboration and presentation platform for corporate data. To support their vision, Microsoft enabled partners to develop custom visuals, which has become a very important part of Power BI’s acceptance and adoption over the years.
Few companies have succeeded more with a partner strategy than Microsoft has. Partners and ISVs both develop flexible and powerful solutions for Power BI and can serve a wide range of requests from both small and large corporations.
Power ON’s Contribution
Power ON has, since 2015, provided Write-back, Planning and Forecasting capabilities for Power BI, and is still the only complete solution for right-time user edits and analysis inside Power BI on Power BI datasets and DAX Measures. We started this journey with a clear vision and mission: Make BI a 2-Way street.
Making BI a 2 Way Street:
Our award-winning Visual Planner™ Engine was part of the broad vision that BI Tools and Financial Planning & Analysis tools would merge into one. Gartner is now publishing material about xP&A (eXtended Planning & Analysis) that has this same vision of blending all planning processes. Ventana Research has also published a whitepaper that endorses the need and popularity of the same concept; Integrated Planning in a BI Tool.
Visualizations:
In addition to enable editing, writeback, commenting, scenarios, and ML with Power BI, Visual Planner™ also need a intuitive user interface through custom Visualizations. Power BI has, since day one, provided the powerful framework for Custom Visuals. The user interface has been embraced by analysts and developers, but not always as easy for those more familiar with Power BI’s sibling; Excel.
Key criteria for Power BI Visuals
- Ease of Use – Looks, feels, and is accessed like any other Power BI Visuals, in addition to be filtered by any filter context applied to a report. (i.e. not using IFRAMES, or Peacock color palettes, or use its own filtering.)
- Ease of Setup – Simple administration, easy to manage, document and edit. Follow Standard Power BI UI Guidelines.
- Collaborative – Share Data Across all of Power BI and with the other Visuals.
- Security & Compliance – Integrate with and support existing security and compliance needs
Making Power BI feel like Excel
In Q1 2022 Power ON will take to market a new set of visuals that will revolutionize the way current users are working with Power BI. More importantly, it will provide a powerful set of features that will open up for Blackbelt Excel users to open up developing business models in Power BI. Power XL comes in 4 modes:
4 Modes of Power XL:
- Forms
- Table
- Pivot
- Reporting
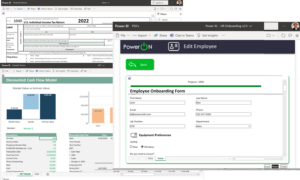
1. Power XL Forms
Create just about any type of form you want. Yes, this is in Power BI, but using the functionality users are used to in Excel.
2. Power XL Table:
Use the popular Excel Table feature to edit, filter, search and replace data, and write it back to Power BI Datasets so the entire organization can view and analyze any data written back.
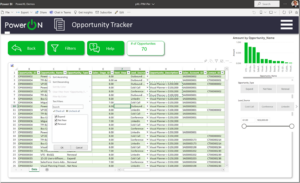
Tables with advanced drop downs:
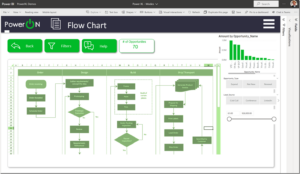
Control and Develop Flowcharts:
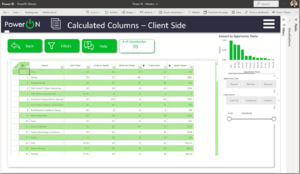
Take advantage of thousands of client side calculations, including ability to calculate in columns:
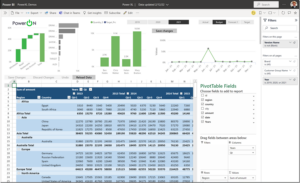
3. Power XL Pivot
The Pivot Mode enables users to use a pivot table inside Power BI without the need to have admin access, or use Power BI Desktop.
Add and use Slicers:
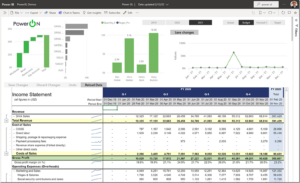
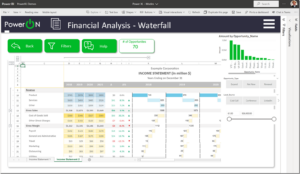
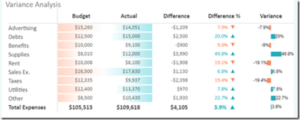
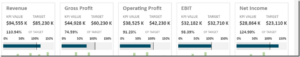
4. Power XL Reporting
Power XL comes with all the same features of Microsoft Excel, including sparklines, conditional formatting, objects, pictures, graphs and calculations all available client-side.
Waterfall with write-back:
Client side – User-defined graphs and visualizations:
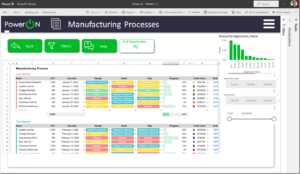
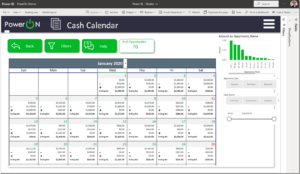
Powerful ways to visualize financial calendars:
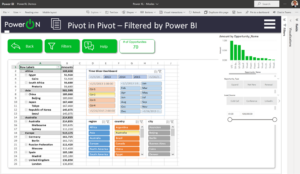
How about a Dashboard in a Dashboard, filtered by Power BI?
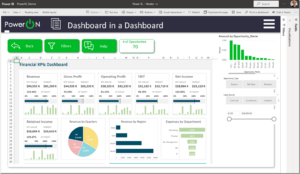
- Note: All visuals are filtered by Power BI filtering and security!
- Visual Planner Write-back: All visuals comes with write-back to Power BI Tabular models.
The Building Blocks of Power XL
Power ON’s Power XL is essentially a spreadsheet that respects the filter context inside Power BI with all the same features of regular Excel. Power XL is web based. Your indispensable corporate Excel model can be imported and published to Power BI with presentation quality layout.
Client-Side Calculations
Aside from all basic functions for Statistics and Finance, you can still use VLOOKUP, INDEX MATCH(), If, SUMIF, AND OR and all your other favorite clients side calculations.
Conditional Formatting
Any type of conditional formatting:
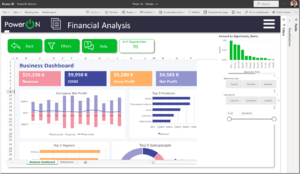
Advanced Dashboards
Users can load the Power BI data, and develop their own client-side advanced dashboards:
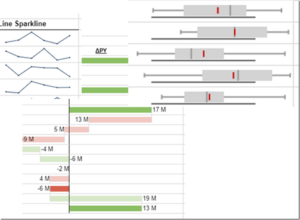
Sparklines
Lines, Bullet, HBar, Area, Scatter, Histogram and Stacked
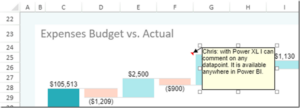
Commenting on Datapoints
Comments can be placed around Power XL. They are stored in a database can be displayed in standard Power BI Visuals.
Next Steps?
If you are a Microsoft Power BI user who liked the Excel experience, or an Excel user who would love to gain access to the expanded power of Power BI, you might consider taking a look at Power ON Visual Planner and Power XL. Power XL will unlock all the capabilities listed above across it all. Power BI & Excel are Better Together isn’t just a tagline; it’s a reality.
Contact us to discuss how you can capitalize on your Power BI investment, with Power ON, to go beyond analysis with write-back, planning, forecasting and more.
Until next time…
Keep Powering ON 🙂