Download sample report
A rich PDF with insights, stats and use cases.
How to Optimize Your Accounts Receivables Dashboards (with Examples)
Strong accounts receivable policies and processes are essential for enterprise success. In the same way that people need to take in oxygen consistently, businesses need to excel at collecting revenue…
Not Ready Yet? Learn More
Support for 140+ data sources


How to Optimize Your Accounts Receivables Dashboards (with Examples)

Strong accounts receivable policies and processes are essential for enterprise success. In the same way that people need to take in oxygen consistently, businesses need to excel at collecting revenue in order to thrive. That’s why so many rely on accounts receivable dashboards to provide transparency and enable oversight.
Accounts receivable dashboards offer a window into everything that matters with A/R. Users can quickly reference key metrics, see updated data in real time, and immediately understand the positives and negatives of performance.
Optimizing your dashboards is about maximizing their relevance, utility, and accessibility. Luckily, all of those factors are within your control. Follow these recommendations to create stellar accounts receivable dashboards that lead directly to more incoming revenue.
Include the Right Metrics
Including the right metrics ensures that your accounts receivable dashboard functions optimally and provides your business with the data it needs. All dashboards should include a clear indicator of outstanding accounts and overdue balances. Depending on their needs, users might also want to track additional metrics, such as average order value or percentage of overdue invoices. As long as the dashboard gives individual users the flexibility to choose which metrics they see, they will always be focused on the right things.
Drill into the Data
An accounts receivable dashboard should be an entry point, not an endpoint. When users can drill into the data on their dashboard, they can explore the underlying facts and figures and understand what kinds of issues are affecting performance. When this is possible, the dashboard becomes more than just a window into data; it becomes a tool for creating and connecting insights to improve accounts receivable performance.
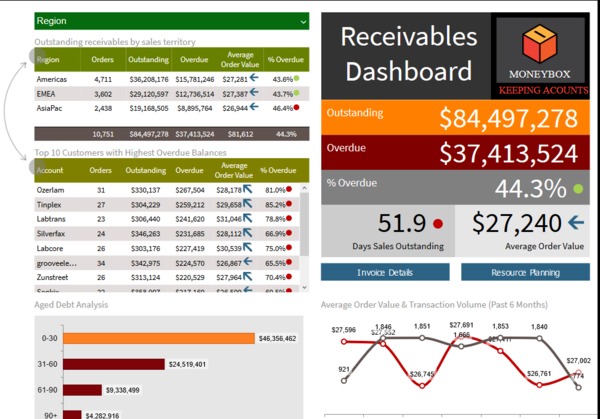
Incorporate Graphs and Charts
How the dashboard looks is just as important as what it includes. Information should be quickly and easily digestible, and the key takeaways should be highlighted. The goal is to glance at the dashboard and immediately be up to speed with accounts receivable.
Incorporating graphs, charts, and other kinds of visualizations along with raw data brings critical points into immediate focus. With these tools, users can see the relationships between the data and come away with actionable ideas. Appealing, intuitive visual design keeps the dashboard from becoming just another spreadsheet.
Extend Accessibility
If dashboards are an asset, stakeholders across the organization should be able to use them. That starts by extending access to more people both inside and outside the accounting department while still managing strict access controls to protect the data. Making dashboards more accessible also means making the tools more user-friendly and the interfaces more intuitive. Ideally, users without tech-savvy or accounting expertise can still rely on these dashboards to improve business performance based on a clear understanding of accounts receivable.
There is no model of a perfect accounts receivable dashboard because the definition is different for every company. Therefore, the single most crucial feature of any dashboard is adaptability. Whatever tool you rely on should be highly customizable and easy for average users to adjust on their own.
Complete the form for instant access to a free A/R dashboard template that you can adapt for your business needs.
Or, if you’re seeking a more comprehensive dashboard with visualizations, try out this interactive tool from insightsoftware.
Optimizing dashboards is just the first step. After that, you need to optimize how you use them. Learn how with this free resource.
Trusted By


