Business Intelligence Reporting Tools
Enhancing Business Intelligence: Strategic Accelerators for Analytics
Unlock the full potential of your data with our agile business intelligence tools and solutions. Experience streamlined decision-making, increased productivity, and transformative business success.
"*" indicates required fields

Tools to Boost Your BI: More Value, More Power, More Insights
Elevate your business intelligence to enterprise-strength reporting and embedded analytics. Supercharge Power BI and Qlik into advanced solutions through write-back and improved accessibility. Upgrade your applications with predictive analytics and seamless data integrations for enhanced user engagement.

Business Intelligence & Analytics
Logi Symphony is modern BI software that allows software vendors and enterprises to augment any application with AI-infused analytics
Advanced Analytics and Write-Back for Power BI
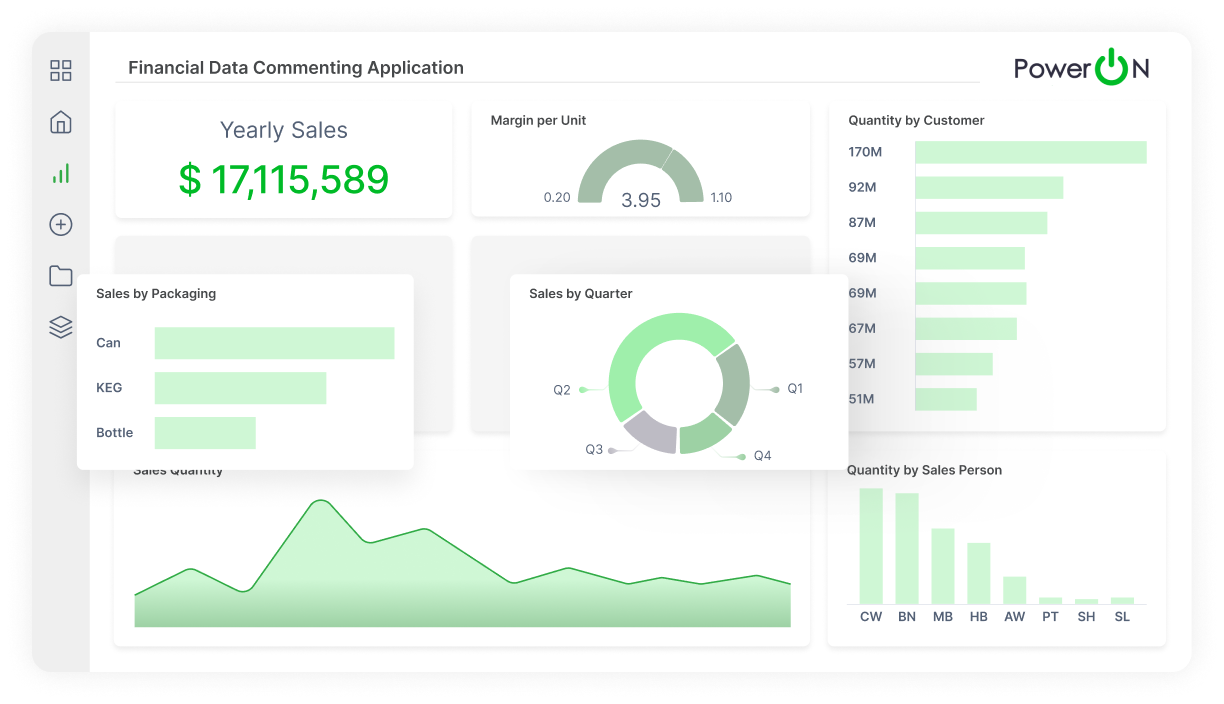
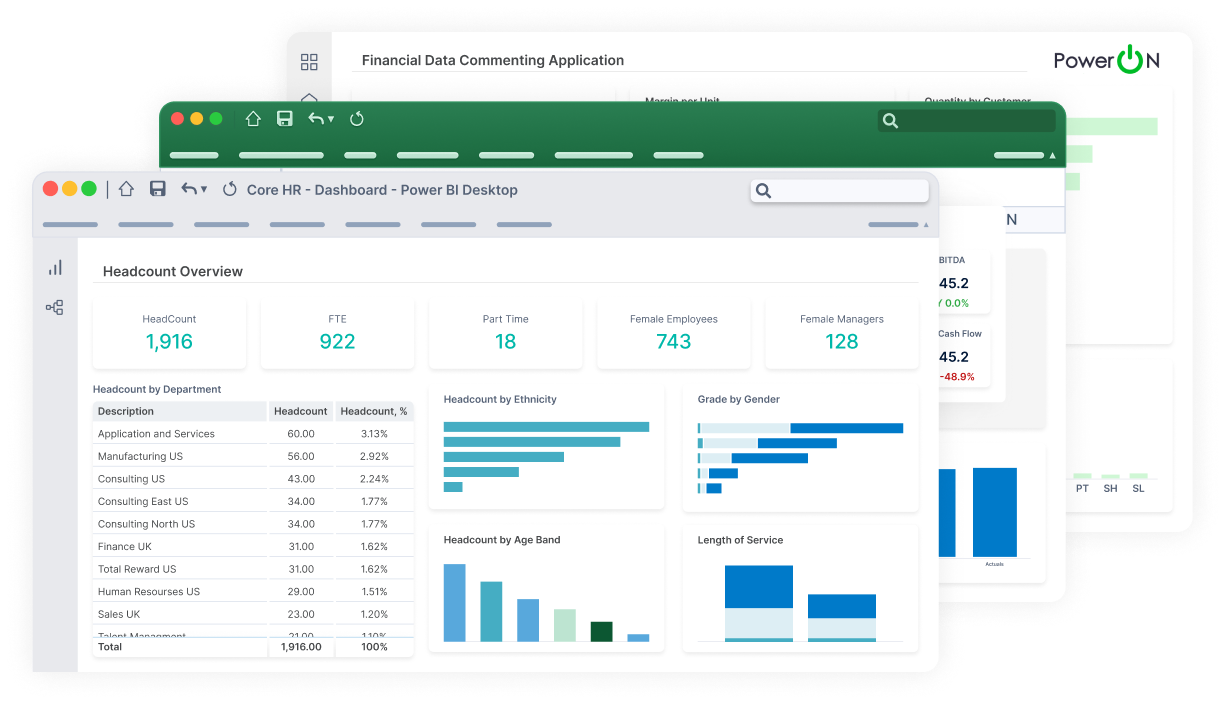
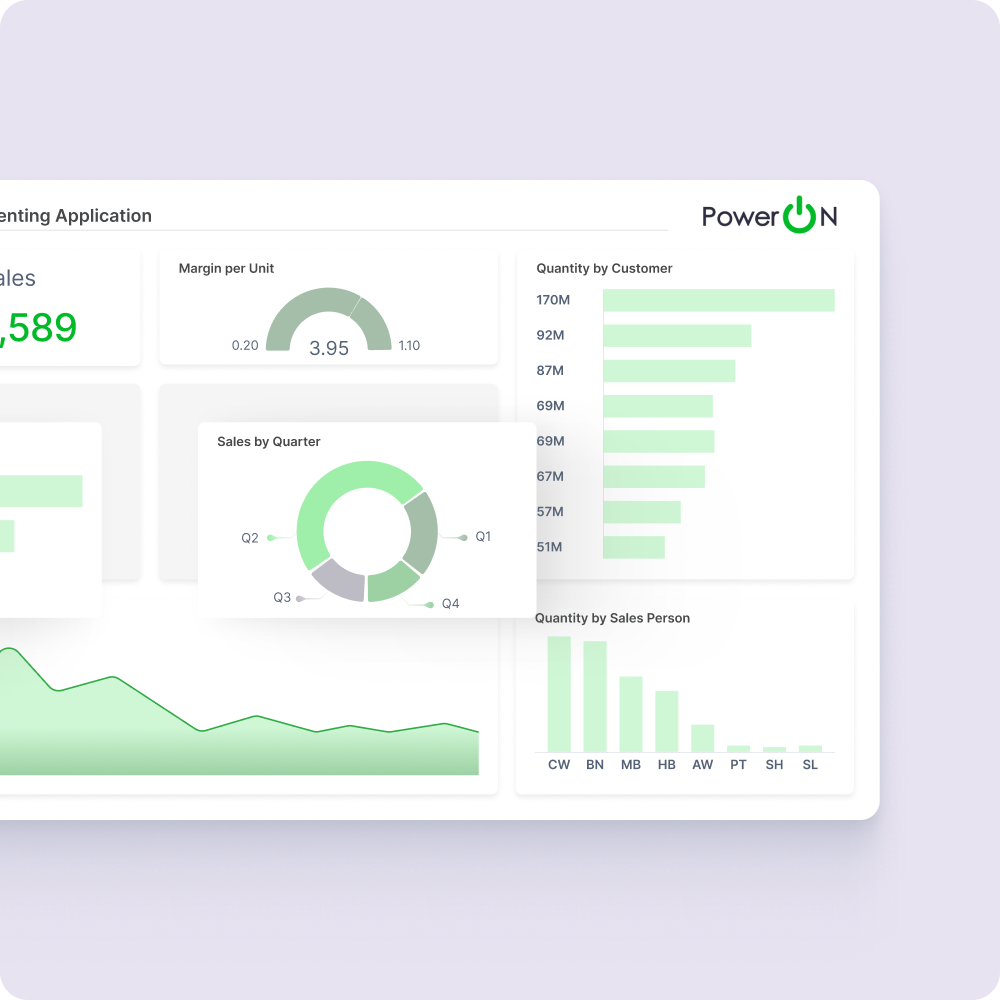
Power ON supercharges Power BI with Excel-like functionality, write-back, and a complete budgeting and planning solution that breaks down silos.

Advanced Analytics and Write-Back for Qlik
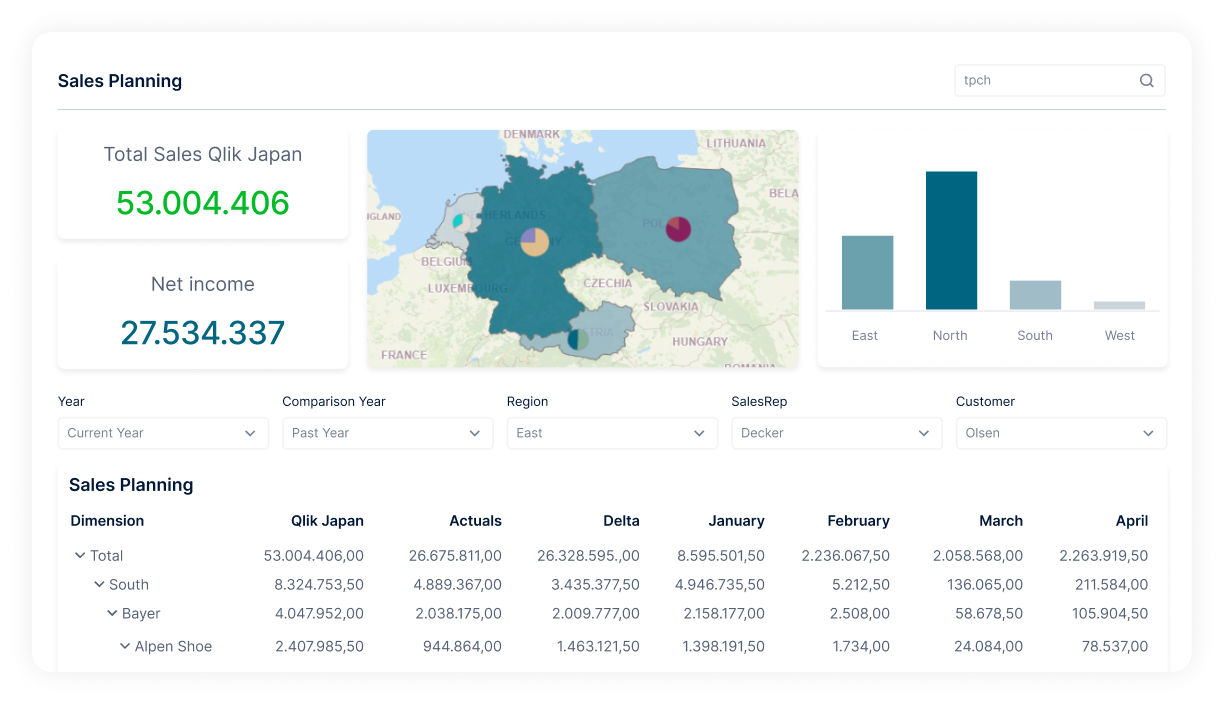
Vizlib unleashes the full power of Qlik Sense and Qlik Cloud with advanced visualization functionality and write-back for effective data-driven decisions.

xP&A for PowerBI
insightsoftware xP&A for Power BI unifies ERP data, streamlines planning, and enhances decision-making for efficient, collaborative forecasting and reporting.
Reporting for Oracle
insightsoftware Reporting for Oracle offers deeper insights from Oracle ERP data with pre-built views and self-serve reporting in Excel, Web, or Power BI.
Data Connectivity
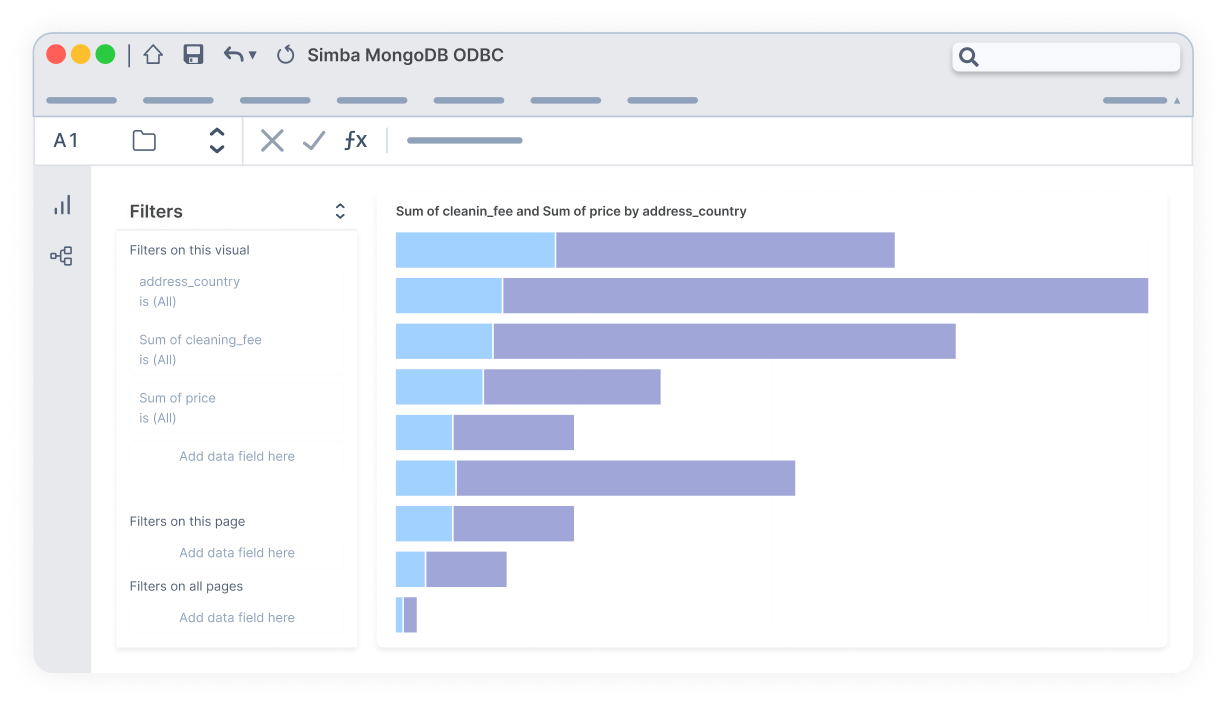
Simba boosts BI and ETL with advanced drivers and an SDK offering seamless data integration, deeper real-time insights, and efficient cloud migration.
Elevate Your Financial Planning
Fiplana streamlines financial planning and data management, offering precise forecasting and insightful analysis.
Elevate BI: Collaboration & Customization Features
Transform how you work with data. Dive into smarter decision-making, seamless data analysis, and fully customized reporting with insightsoftware business intelligence tools. Experience collaboration like never before, empowering your every insight. With us, your BI journey becomes a beacon of innovation and impact, tailored just for you.
We Connect to 200+ Data Sources


Powerful Business Intelligence Tools to Drive Your Data Culture
Solve your organization’s data needs by building workflows directly in your BI tools, leveling up your data visualization capabilities, and embedding advanced analytics into products and applications.

Competing in today’s world requires you to be able to connect your analysis with decisions and actions. Reporting needs to be more than read-only dashboards, drill downs, and “export to spreadsheets.” Enabling users to analyze, enter, and manage data all in the same place helps your organization make faster decisions, accelerating business results and providing long-term value. This is made possible by tools like Power ON and Jet Reports, enhancing your data analysis and BI reporting like never before.
Understanding complex data ensures a unified confidence across the organization. Users should feel empowered to create their own visuals, transforming raw data into actionable insights and compelling stories. Being able to deliver data-driven business decisions without needing to depend on IT experts provides measurable long-term value to the organization and drastically improves overall agility.
In today’s competitive landscape, it’s essential to integrate analysis ahead of any decision-making. Beyond static dashboards, empowering users to analyze and manage data in a single unified report enhances ROI. Transforming complex data into stories fosters confidence and drives intuitive, data-driven solutions. Jet Analytics helps consolidate data from multiple sources into a single source of truth so everyone works from the same information.
Empower your enterprise with a BI solution that outperforms traditional systems. insightsoftware incorporates flexible, AI-driven analysis and advanced visualization to unlock actionable insights across our platforms. Tailored for rapid decision-making, our solutions offer you a strategic edge in the fast-paced market, focusing on your needs and specific industry.
Get the Most Out of Your BI & Analytics Investment
insightsoftware business intelligence reporting tools empower diverse roles and industries, providing data insights for decision-makers and streamlining processes for operational efficiency across your organization.

Product Manager
Product Managers integrate analytics for enhanced features, revenue boost, and competitive edge. They seek partnerships for data expertise, risk mitigation, and cost reduction through efficient tools that save time on content delivery and more.

BI Manager / Implementer
BI Managers aim to deliver actionable insights to end-users through comprehensive dashboards. However, they need efficient tools for content creation, ensuring a balance between quality and timely delivery to enhance the overall user experience.

Application Developer
App Developers are vital for integrating embedded analytics into third-party applications, ensuring a smooth connection. Their focus on seamless integration enables users to access powerful analytics features from a broader variety of environments.
C-Suite
C-level executives champion data visualization and BI to cultivate a data-driven culture and enable actionable decision-making. They transform complex data into insights, guiding strategic goals and competitive advantage.

Healthcare
Distilling big data into bite-sized chunks for practitioners, clinicians, nurses, and support staff is vital for the success of healthcare organizations. Our data analytics solutions help end-users more easily visualize their data for efficient and life-saving decision-making.

Financial Technology
Empowering fintech with analytics, we transform complex financial data into actionable insights for risk and compliance. Our solutions support firms by enhancing security, improving service, and streamlining decisions for a robust financial ecosystem.

Manufacturing
Manufacturers rely on up-to-date information to maintain and optimize everything from plant floor activities to logistics. Our business intelligence solutions help streamline your operations to better support strategic goals.

Government
Enhanced BI and analytics empower governments and agencies with the right solutions, allowing for smarter policymaking, reimagined service delivery, and more efficient operations. By harnessing data insights, governments can better serve citizens while optimizing taxpayer resources.

Nonprofits
Nonprofit organizations thrive with enhanced business intelligence and analytics because it fuels faster, better data-driven decisions, streamlines operations, reduces costs, and amplifies impact. When every donation counts, it’s critical to streamline processes with BI tools like ours.

Retail
Retail organizations can grow and thrive with data-driven insights. Our enhanced business intelligence solutions fuel strategic pricing, enable supply chain optimization, improve inventory management, and drive customer satisfaction.

Energy & Utilities
Energy and utility companies excel with data-driven insights. insightsoftware business intelligence and analytics tools enhance power outage prediction, equipment maintenance decisions, system efficiency, load management, and customer service.
Take a look at our upcoming and on-demand Business Intelligence and Analytics webinars packed with handy tips, best practices, and insights, brought to you by insightsoftware’s product and solutions experts.

Supply Chains Reimagined: How Century Uses Logi Symphony to Track Global Shipping in Real Time

Supercharge Power BI with Write Back & Planning

2024 & Beyond: Revealing Vizlib’s Product Roadmap
Business Leaders Enhance Their BI Reporting with insightsoftware Tools
20% reduction in reporting time
California Olive Ranch overcame retail trade planning challenges with Microsoft Power BI and Power ON. The solution streamlined forecasting, improved collaboration, and boosted accuracy. Results include quarterly forecasting, budget confidence, and enhanced collaboration across departments.
Read More
Improved product quality leading to more customers
Sisense utilized Simba’s ODBC connectors and SDK for enhanced analytics, enabling easy access to MongoDB and Google BigQuery. This allowed users to merge large datasets and share insights effortlessly, positioning Simba as a key component in improving data connectivity and analysis capabilities.
Read More
Increased Productivity by 300%
Otsuka Pharmaceuticals enhanced their financial reporting and operational analytics with Logi Symphony. The solution improved data visibility and streamlined reporting processes, enabling Otsuka to efficiently monitor KPIs and optimize operational performance. With flexible, scalable dashboards, Logi Symphony empowered Otsuka’s teams to make more informed decisions faster, boosting accuracy and enhancing overall business agility.
Read More
Business Intelligence FAQs
Business intelligence, also known as BI, emphasizes descriptive and diagnostic reporting. In other words, it collects, cleans, and visualizes data to help users understand what happened and why. Typical BI outputs include dashboards, scorecards, and operational reports that surface trends and outliers in your KPIs.
In contrast to BI, data analytics is a broader category that extends beyond business intelligence. Instead of just descriptive and diagnostic methods, data analytics also encompasses predictive and prescriptive methods. Beyond simply reporting, it may leverage statistical models, machine learning, and a multitude of other techniques and tools to forecast future outcomes and recommend actions.
BI dashboards are interactive canvases that combine multiple visualizations using data from multiple sources into a single, unified report. These are great for executives and analysts to get an at-a-glance overview of business performance. BI dashboards generally have the additional option to dig in deeper with tools like filters, drill down/up, and alerts.
Therefore, BI reporting is the actual process of generating these business intelligence dashboards, typically made up of tables, charts, and graphs. These elements translate raw data into actionable information and insights, and BI tools streamline this process. A BI reporting tool is software that helps users connect multiple data sources (ERPs, CRMs, spreadsheets, data warehouses, etc.), model and transform data, design visualizations and layouts, and publish their dashboards to share with others.
Static reports and visualizations are layouts exported as a PDF, Excel file, or printed pages. These don’t change or update, but can be ideal for regulated disclosures, board packs, or ad hoc sharing. Interactive reports (as the name suggests) are accessed via a web portal or other online environment and can be manipulated and refreshed. These often involve on-demand filtering, data exploration, and more for users to adjust.
Start by asking yourself a question: What is the decision or behavior you want to influence? Based on the answer to this, choose charts that can effectively portray what you want to highlight. For example, line charts are great for trends, bar charts can be used for comparisons, and box plots or histograms are useful for distributions. From there, make sure to minimize clutter and keep the focus on the primary objective of the report. Lastly, interactivity features like filters, sort orders, and more can make your visualizations stand out and more valuable.
Adopting specialized BI solutions can significantly enhance project outcomes. These tools help overcome the common issue of trying to fit square pegs into round holes, where businesses expect incumbent BI products to meet all needs universally. Additionally, agile approaches ensure more tailored, effective solutions, leading to decisive success and transformative results. However, factors like executive buy-in and sponsorship, clear scope, secure data governance, and training all act as the foundation of your BI projects and also need to be considered.
Strategic accelerators are industry- or function-specific starter kits that often include pre-built data models, ETL templates, ready-to-use dashboards, and vertical-tailored KPIs. These not only help avoid “blank page syndrome” and speed up requirements gathering, but also introduce advanced features like BI write-back, actionable analytics, AI and ML predictions, and enhanced visuals. Accelerators can also augment your existing BI technology stack or replace it altogether. This flexibility allows for precision and customization tailored to specific business needs.
Common hurdles faced by users include data silos, governance issues, performance bottlenecks, limited change control, and more. insightsoftware offers products specifically designed to enhance Power BI and Qlik Sense offerings, addressing challenges such as the ones listed above, as well as limited dynamic data use, missing data connectivity, and loose embedded analytics, facilitating more effective data exploration and decision-making.
Incorporating natural language engines, such as those used by our Lineos platform, enables users to ask questions as they would speak them. This lowers the barrier to uncover insights for non-technical users, reduces reliance on IT developers, and accelerates decision cycles.
Real-time connectivity to source systems like your ERP, CRM, or IoT transforms BI tools by ending the cycle of delayed reporting. Immediate access to insights and trends empowers proactive decision-making, enhancing strategic actions with comprehensive, seamless data integration.
Tools like Jet Analytics and Logi Symphony enable predictive analytics like forecasting sales, customer churn, and more. When it comes to implementation, charts with “predicted vs. actual” can help visualize the data. Software like Power ON further enhances this with what-if scenario modeling to compare multiple different possibilities, right in Power BI.
Embedded analytics improve end-user experience with data insights, offer faster “time to value” in expanding product offerings, and reduce tech debt, enabling quicker market entry. By adding compelling analytics into your own applications, you enhance user stickiness (they don’t have to leave to find information) and set your product apart from others. This, in turn, reduces churn as customers rely more on embedded dashboards within your application.
Effective BI tools not only benefit the overall business, but also its users. They can build and modify reports without waiting for IT to handle it, which improves agility and iteration speed. This also reduces the burden on IT, freeing them up to focus on governance and infrastructure instead of ad hoc dashboard tweaks. Lastly, by enabling users to directly work with data explorations hands-on, it boosts data literacy across the organization.
Start with the discovery phase by interviewing stakeholders (most likely representatives from finance, operations, sales, and IT teams) to map out current reporting pain points, data sources, and KPIs. Then, deploy a foundational tool like Jet Analytics to set up an ETL pipeline that connects directly to your ERP and other systems and automates data extraction (optionally on a predefined schedule). From there, you can start creating dashboards — we recommend starting in familiar interfaces like Excel. Jet Reports is an Excel-native reporting tool that vastly expands its dashboarding functionalities and includes pre-built templates to get you up and running faster. Particularly important for regulated industries, make sure to implement security and governance protocols like role-based access and automated validation rules (both already supported by Jet Analytics).
Once all of this is set up, you can determine report distribution cadences — whether daily, weekly, monthly, etc. It’s important to run training with your teams to show them how to build, modify, and maximize the value of their dashboards, including how to make department-specific layouts. From there, you can begin to iterate and scale, holding monthly reviews to onboard new data sources, retire unused reports, and identify priority enhancements.
Looking for inspiration? Browse and sample our library of interactive dashboards – created with Logi Symphony.
Jet Reports is an Excel-native operational and financial reporting tool whose familiar interface can enhance your BI reports without frustrating learning curves. Jet Analytics further bolsters this business intelligence competency by automating ETL for ERPs, CRMs, and more. It also builds dimensional models in SQL Server or Azure, and includes built-in data quality checks to ensure valid data is fed into these models. Used together, the Jet suite of software streamlines your pipeline from data extraction to dashboard creation and distribution.
To take your BI dashboards a step further and install them directly in other applications, Logi Symphony facilitates embedded analytics with ease. For those already using Qlik platforms, Vizlib is an ideal choice for enhancing visualizations, customization, and more. It also enables native data write-back, so you can save time and speed up reporting cycles.