Logi Symphony Dashboard Gallery
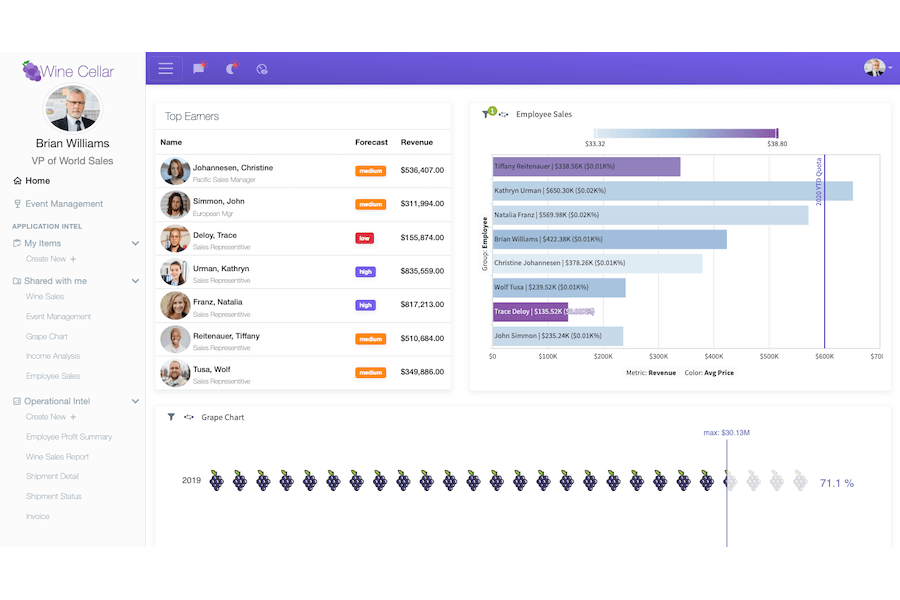
Wine Cellar
Industry: Retail
Features:
- Embedded Self-Service Dashboard with Another Application
- Branded and White-Labelled Login Screen
- Full Interactivity (Drill Down, Raw Detail, Revisualization and More)
- Custom Data Visualization
- Fluid Layout
- Note: You’ll need to click “Sign In” within the dashboard to view it
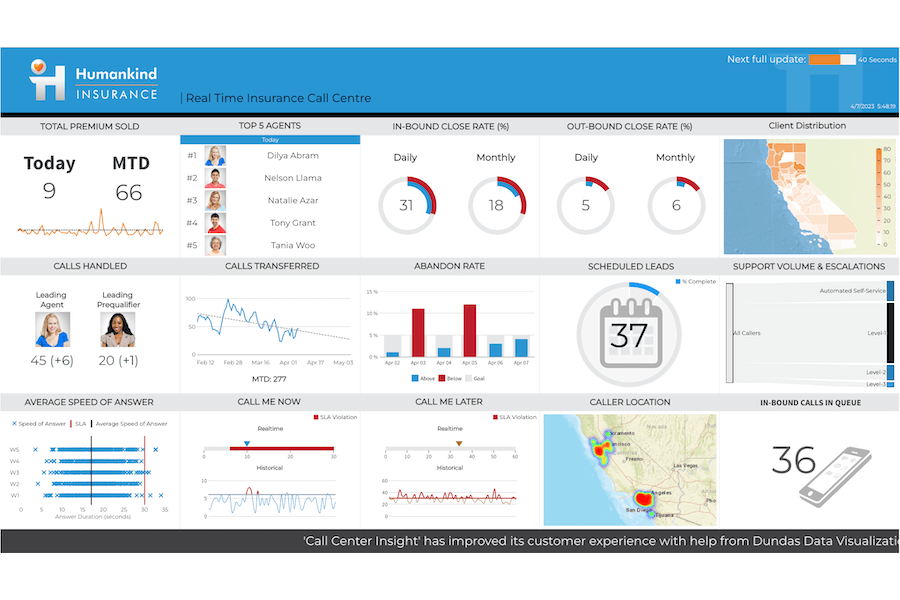
Humankind Insurance
Industry: Call Center
Features:
- Real-time Automatic Updates
- Television / Wallboard design (1920×1080)
- Pixel Perfect Design
- Large Variety of Data Visualizations
- News Reel
- Custom Animations
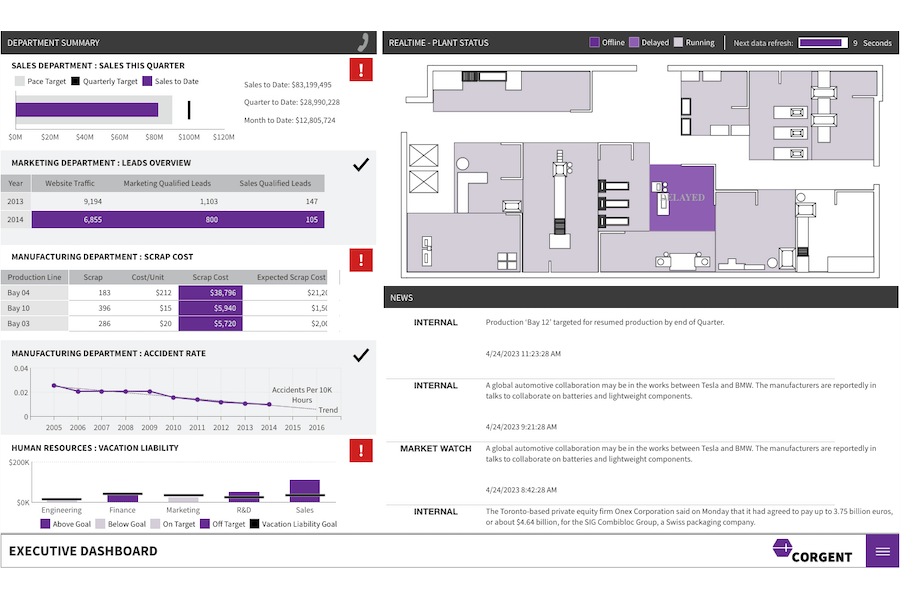
Corgent Company Dashboards
Industry: Manufacturing, Sales, Marketing & Human Resources
Features:
- Contains 7 Different Dashboards/Reports
- State Driven Executive Summary
- Custom Diagram and Other Robust Data Visualizations
- Deep Multi-Level Drill-Down
- Custom Animations
- Optional Pixel-Perfect or Scaled Layout
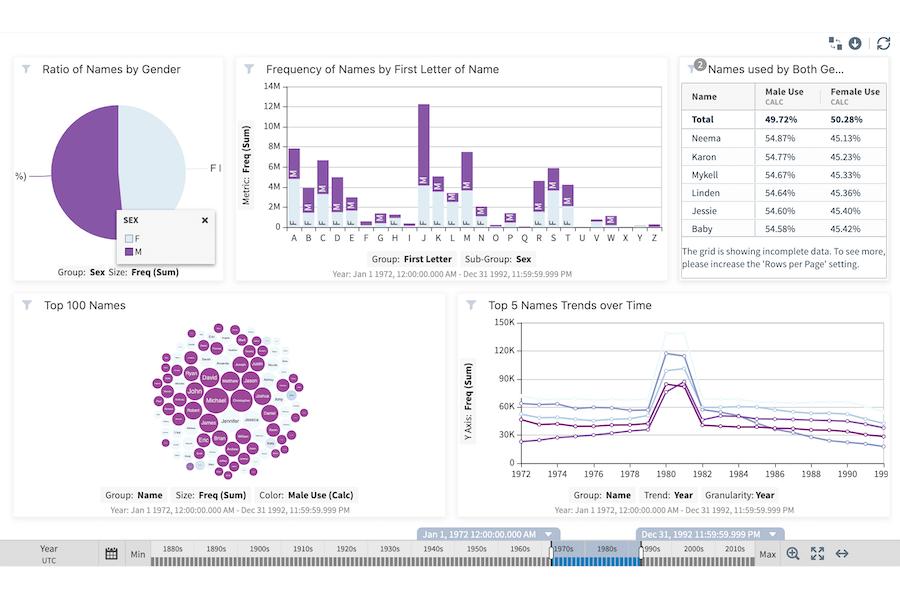
Baby Names Dashboard
Industry: Social Statistics
Features:
- Interactive Date/Time filtering with Time bar
- Exporting (Image and PDF)
- Self-service and Customable Layout
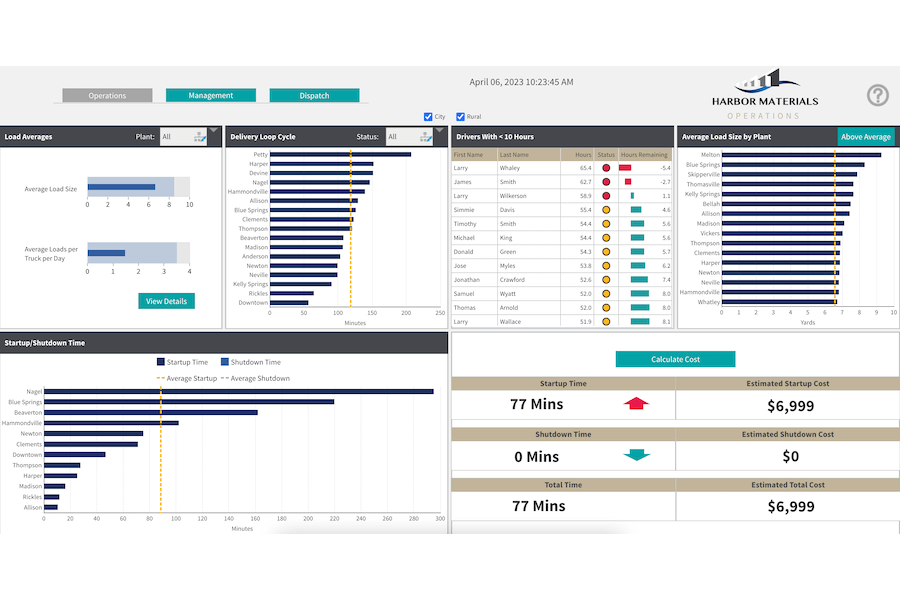
Harbor Materials
Industry: Construction / Aggregates
Features:
- Responsive Design
- Navigation (3 dashboards)
- Forecast and Analysis (Management page)
- State Indicators
- Help Overlay
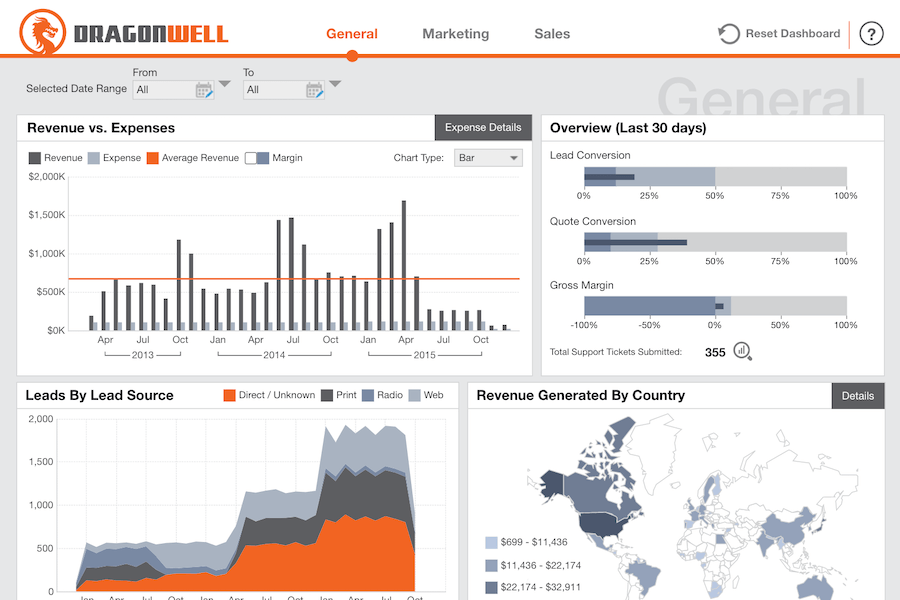
Dragonwell Dashboard
Industry: Sales / Marketing
Features:
- Clean Easy-to-Use Managed Dashboard
- Simple Filtering
- Help Overlay
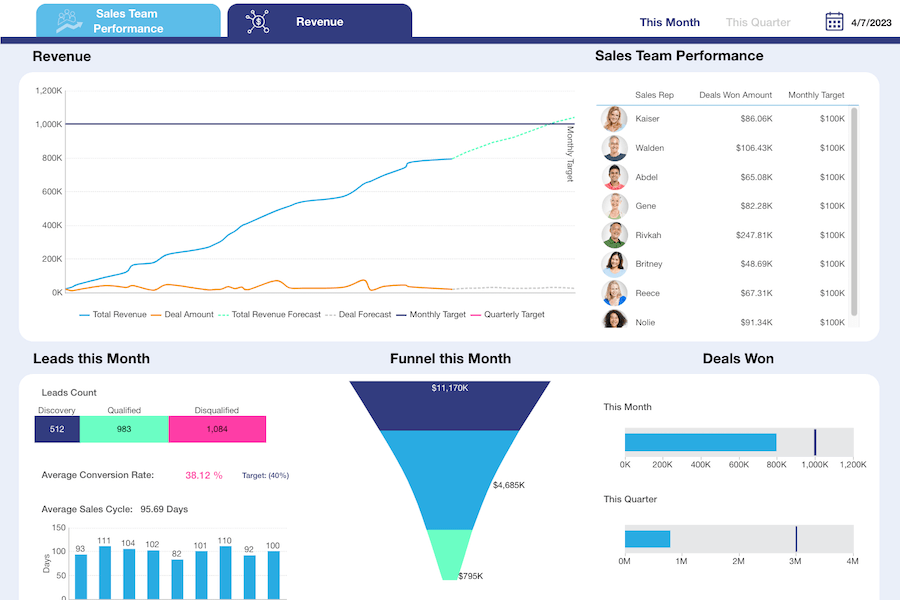
Sales Management Dashboard
Industry: Sales
Features:
- Navigation with two Dashboards – Sales Team Performance and Revenue
- Predefined Date Views (Today/This Month/This Quarter)
- Forecasting
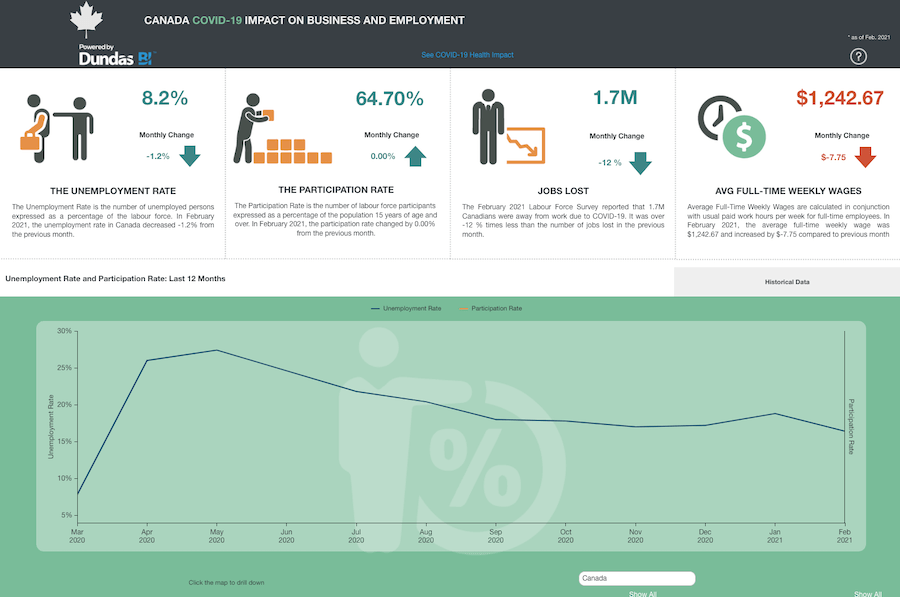
COVID-19 Impact on Canadian Business and Employment
Industry: Research/Social
Features:
- Infographic Style
- Responsive Design
- ‘App-like’ user experience
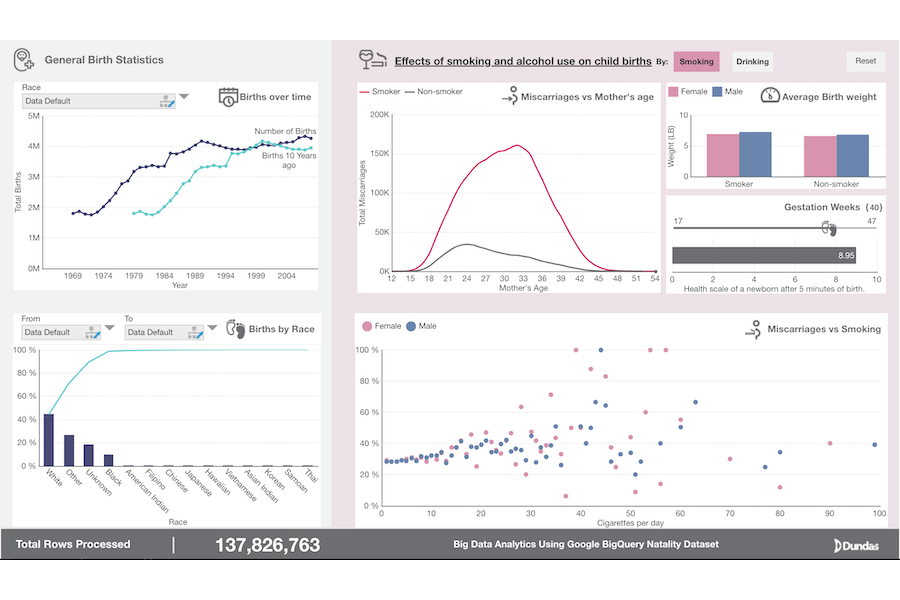
Google BigQuery Natality Dashboard
Industry: Political / Social
Features:
- Big Data Analytics using Google BigQuery (137,826,763 rows processed)
- Data Aggregation
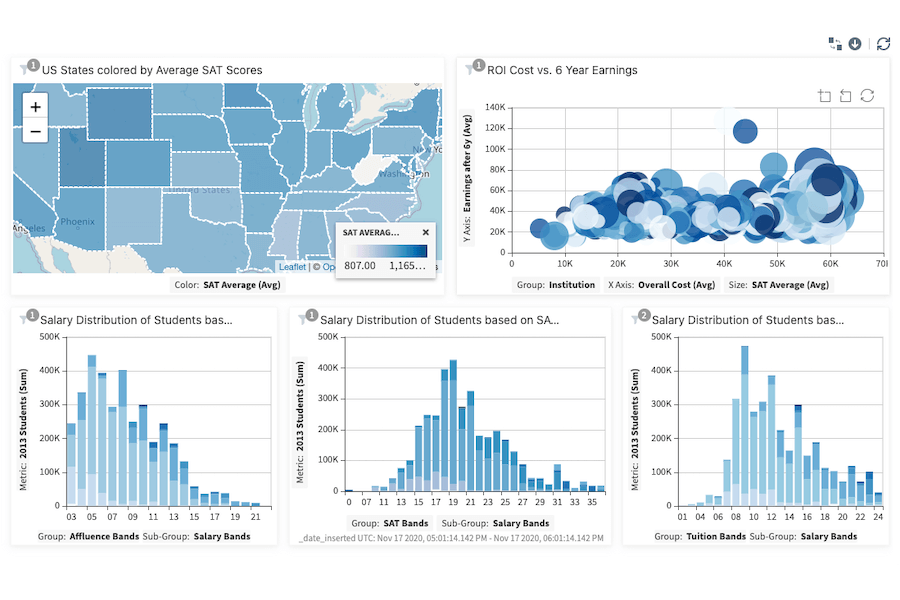
College Education Dashboard
Industry: Education
Features:
- Interactive Map Drill Down
- Self-Service BI – change metrics along chart axes
- Compare metrics against one another
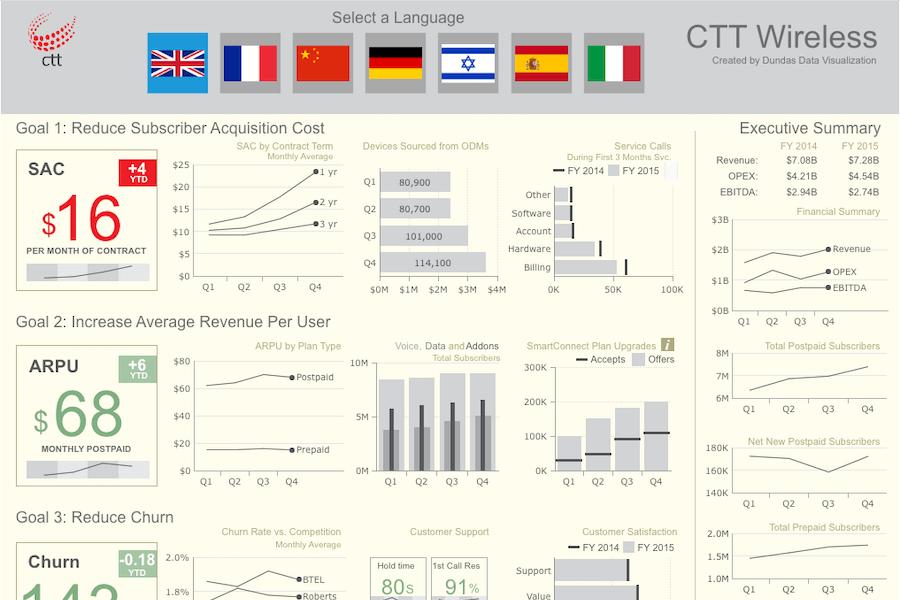
CTT Wireless
Industry: Technology
Features:
- Goal-driven Metrics
- Best Practices Orientated
- Multiple Language Support (Localized)
- High Data Density (Micro visualizations)
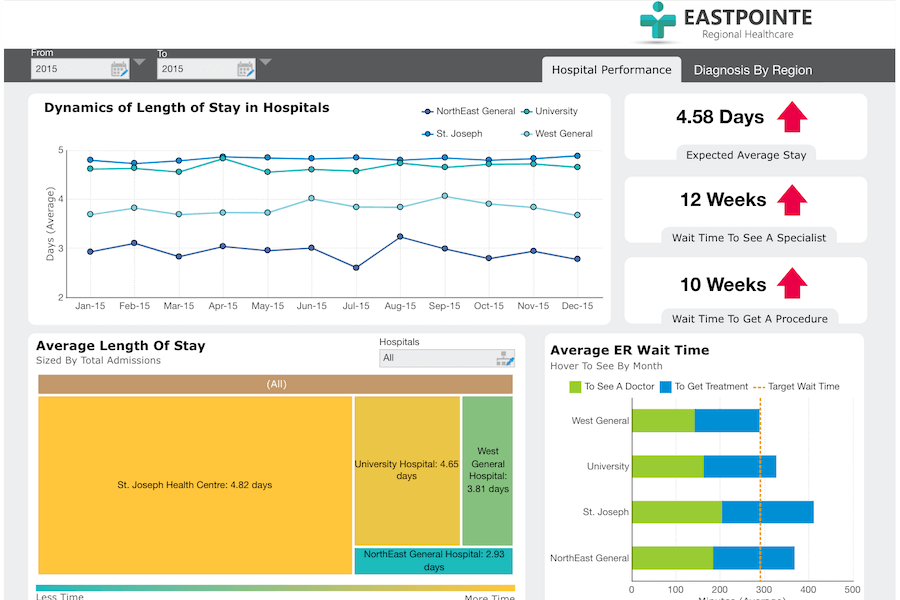
Eastpointe Regional Healthcare
Industry: Healthcare
Features:
- Simple Interface
- Tab-Style Navigation
- Treemap Visualization
- Multiple Select Filtering Options
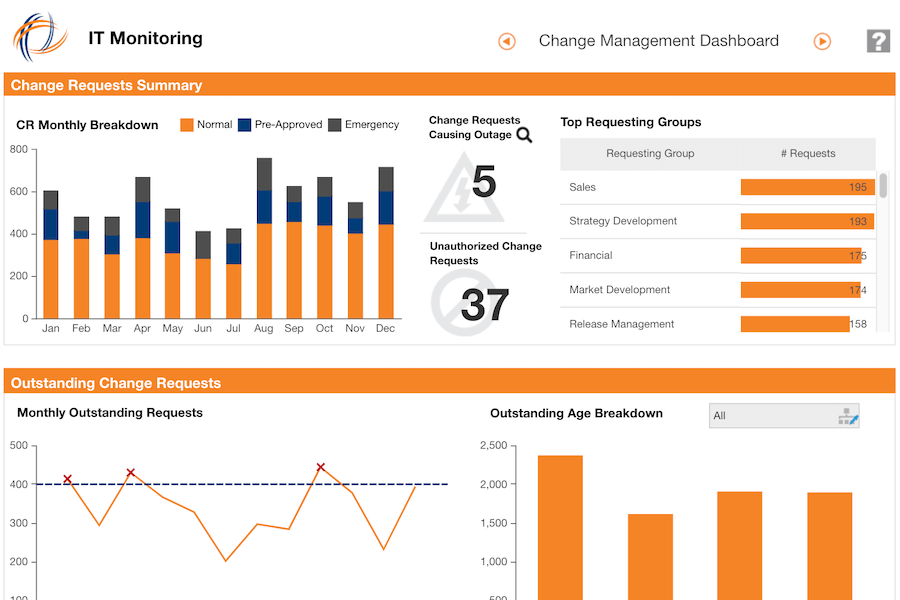
IT Monitoring Dashboard
Industry: Information Technology
Features:
- Good for Notifications / Alerts
- State-based At-a-Glance Design
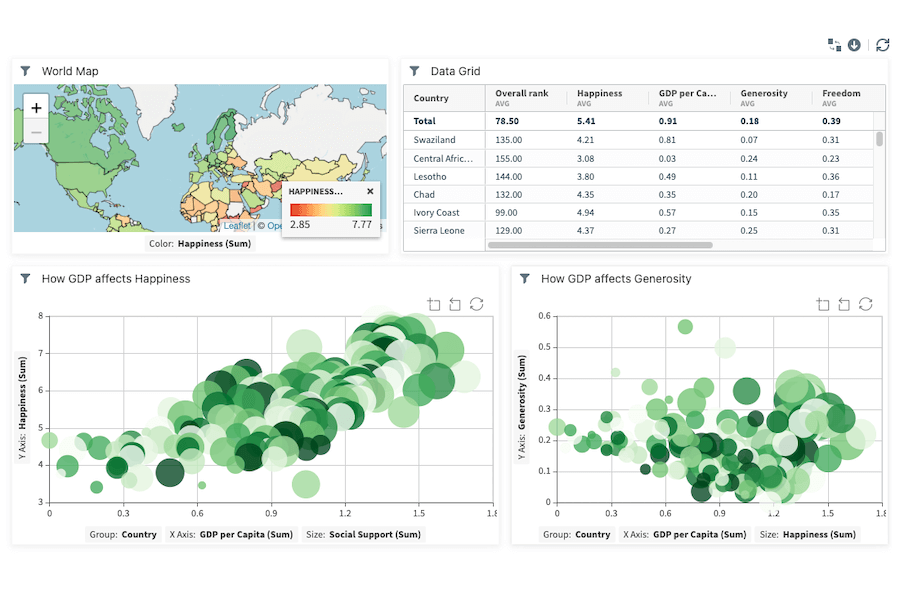
World Happiness Dashboard
Industry: Social / Government
Features:
- Multidimensional Data Visualizations
- Combination of Maps, Tables and Charts
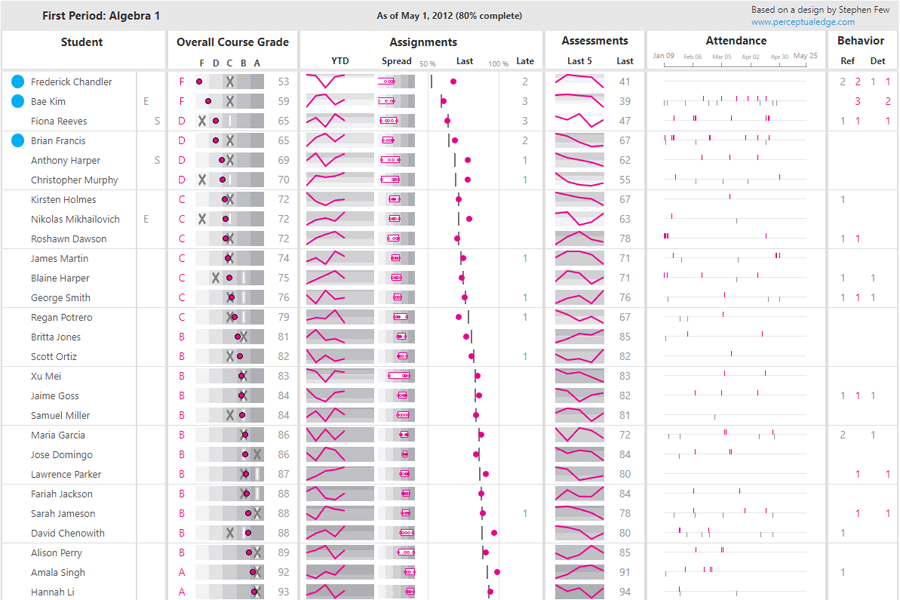
Student Performance Dashboard
Industry: Education
Features:
- By the Book, Best Practices Design
- Data Dense, Scannable
- Micro-visualizations (sparklines, bandlines)
- Historical vs. Current
- Colorblind Accessibility
- State Indicators