Vizlib
Extend Qlik Instantly & Give Users the Self-Service Tools They Need
Vizlib is the most flexible suite of Qlik Sense extensions and enhancements for advanced data writeback and building custom interactive reports. Explore, edit, and collaborate, all from within Qlik Sense’s interface — without compromising security or workflows. Trusted by global customers and now part of insightsoftware’s business intelligence offerings.
See for yourself why 500K+ users are using insightsoftware to draw instant data insights, react swiftly to market changes, and outpace their competition


Stop Waiting Weeks for the Dashboards You Need
Business Teams Stuck Waiting for IT Help
You need specific visualizations Qlik doesn’t offer—Gantt charts, financial reports, custom KPIs. But your BI team is buried in requests. So you wait weeks for dashboards, then more weeks for updates. Or you export to Excel and lose real-time data.

Your Filtered Views Hide Critical Insights
Dashboard filters show what you’re looking for but hide everything else. You miss patterns, anomalies, and opportunities because you can’t see beyond your current view. Without the full picture, you’re making decisions with incomplete information.

Can't Update Data Where You Need To
Found an error in your forecast? Need to add context to an anomaly? You have to track down the source system, make changes there, wait for the next data refresh, then check if it worked. Meanwhile, your team works from incorrect or outdated data.
Build Exactly What You Need When You Need It
Build Your Own Dashboards in Minutes, Not Weeks
Drag and drop data fields, apply filters, and create visualizations using familiar Excel-like functions. No coding required, no waiting for IT. Business users become self-sufficient analysts who can modify dashboards as needed. Hidden Insights AI pulls out trends and anomalies you might miss, explaining them in plain language. Share with one click, export when needed, and iterate based on feedback—all without technical help. Your BI team escapes the endless request queue and focuses on strategic initiatives that move the business forward.
Get Instant Demo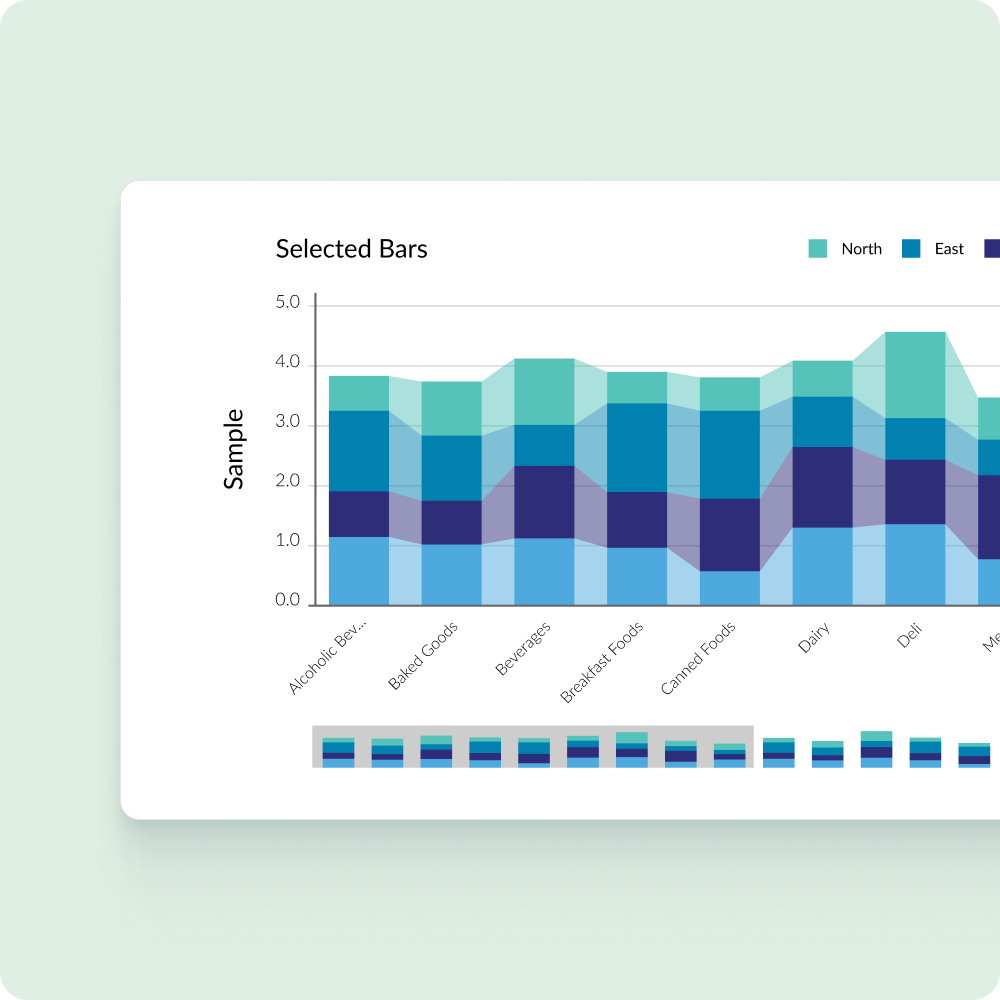
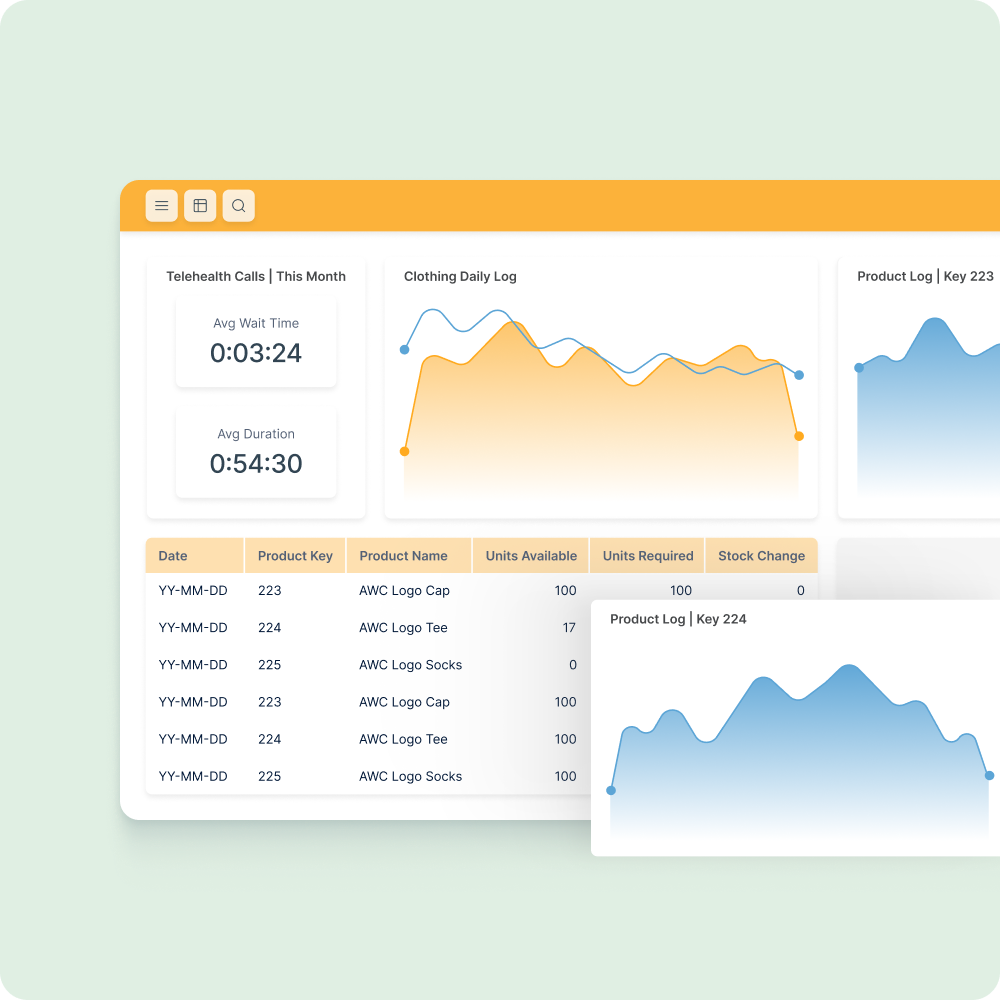
Get 40+ Visualization Types Qlik Doesn't Provide
Access 40+ chart types ready to use—from Gantt charts to Sankey diagrams to custom KPI tiles. Drag, drop, and configure without writing code. Optimize visualizations for your specific business use cases. Save templates for reuse, ensuring consistent, professional dashboards across your organization. AI-powered chart summaries instantly explain what your visualizations mean, helping everyone understand complex patterns at a glance. Stop settling for basic bar charts when you need specialized views. Get the exact visualization for your data story.
Get Instant Demo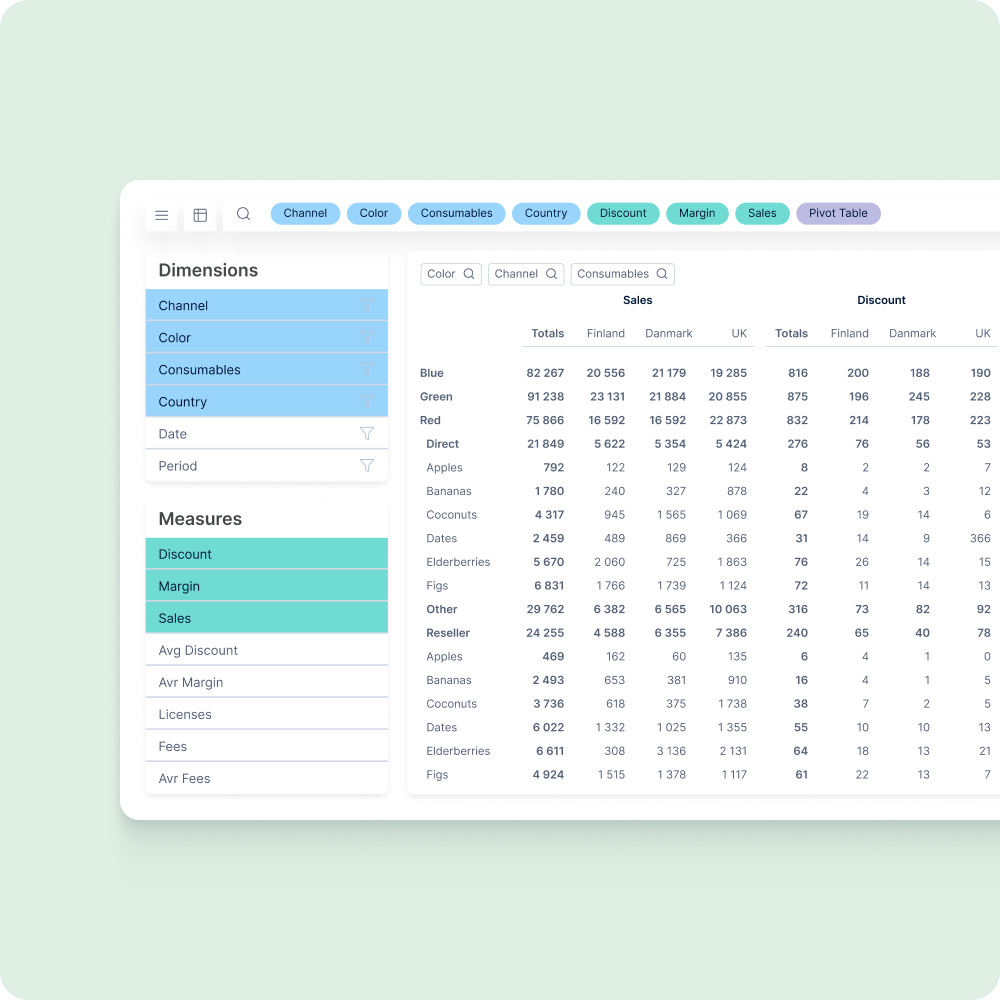
Make Your Dashboards Collaborative Workspaces
Add comments directly on data points to explain variances or flag issues. Tag colleagues for input on anomalies. Track who changed what and when with full audit trails. Update data right in the dashboard—changes flow back to source systems automatically, keeping numbers accurate. Hidden Insights AI provides insights everyone can see and discuss, ensuring teams align on what the data means. No more Excel exports, email chains comparing versions, or meetings to debate the numbers. Your entire team works from one source of truth with full context.
Get Instant Demo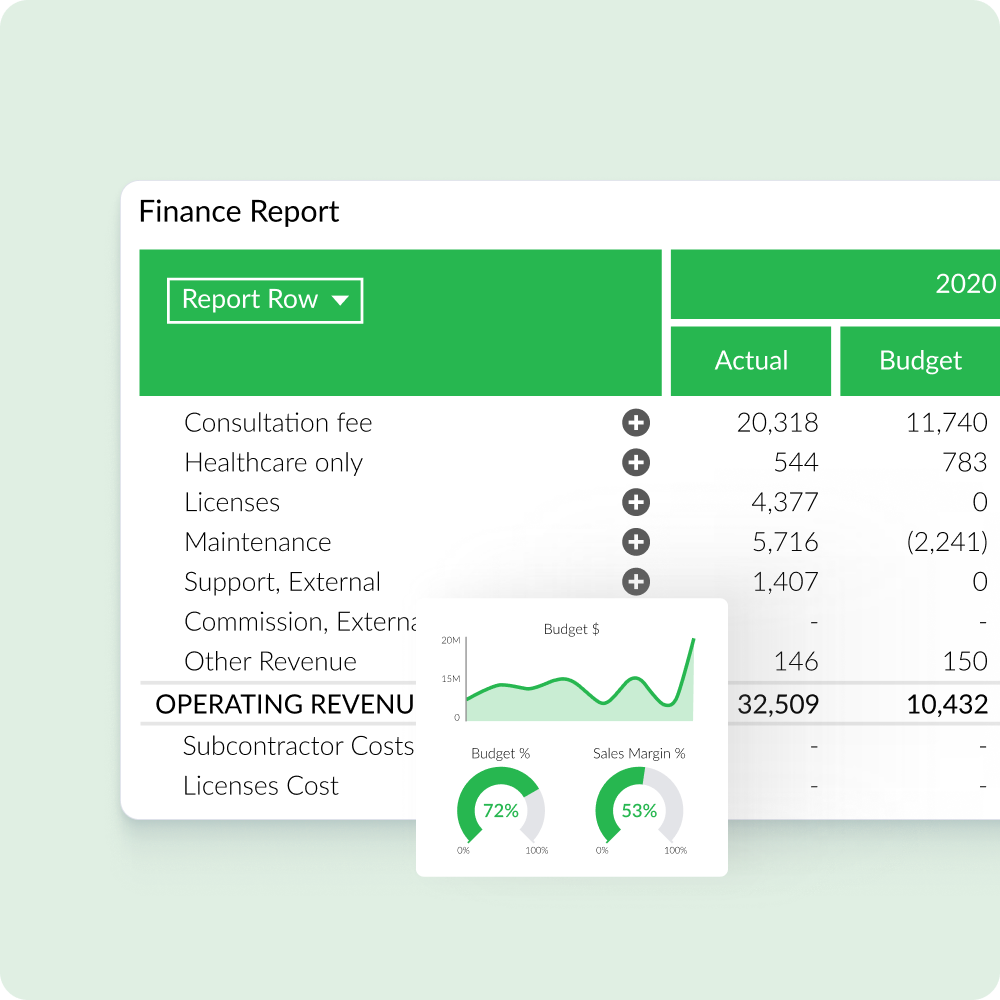
Easily Create Financial Reports Inside Qlik
Handle complex hierarchies, ragged structures, and consolidations natively—no more wrestling with Qlik’s limitations for financial data. Build P&L statements, balance sheets, and variance analysis that finance teams can use. Add commentary directly in reports for month-end explanations. Update budgets and forecasts in real-time with write-back capabilities. Export board-ready PDFs that maintain perfect formatting. Your finance team stops fighting with IT about report layouts and gets pixel-perfect financial statements that match your exact needs.
Get Instant Demo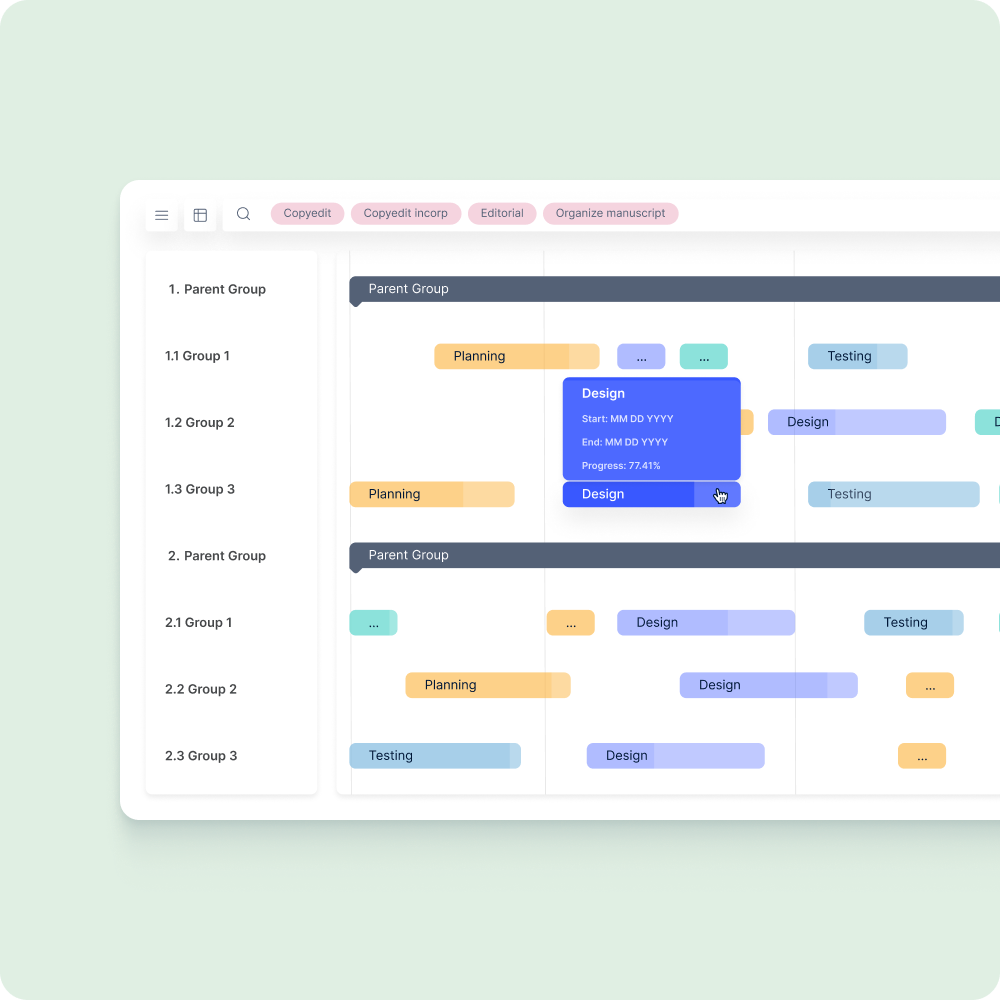
Track Projects Where Your Data Already Lives
Visualize timelines, dependencies, and resource allocation directly in Qlik dashboards. No more disconnected project data in spreadsheets while your actuals live in Qlik. Update project status and spot bottlenecks instantly. Keep project data connected to broader business metrics. See how delays impact revenue, how resource changes affect costs, and which projects move the needle. Perfect for manufacturing schedules, construction timelines, or any operation where you need to see what’s happening when—and understand the business impact immediately.
Get Instant Demo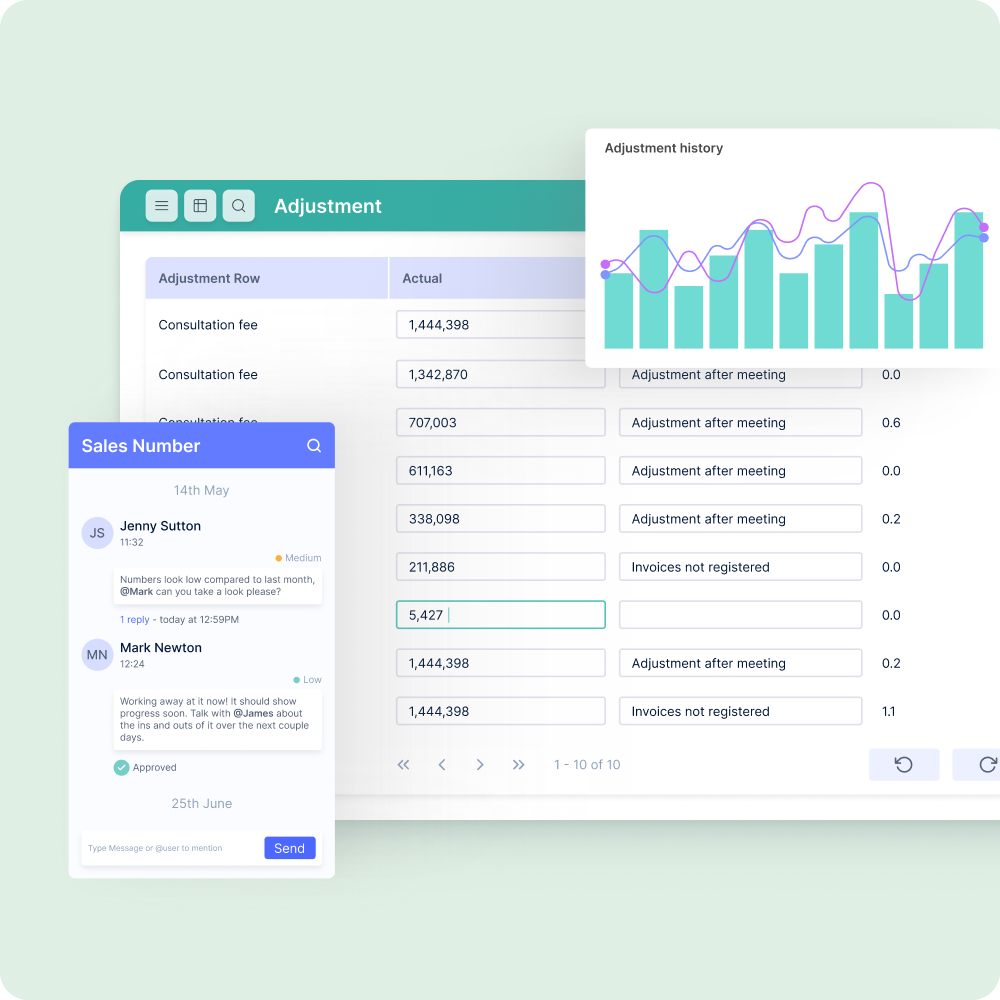
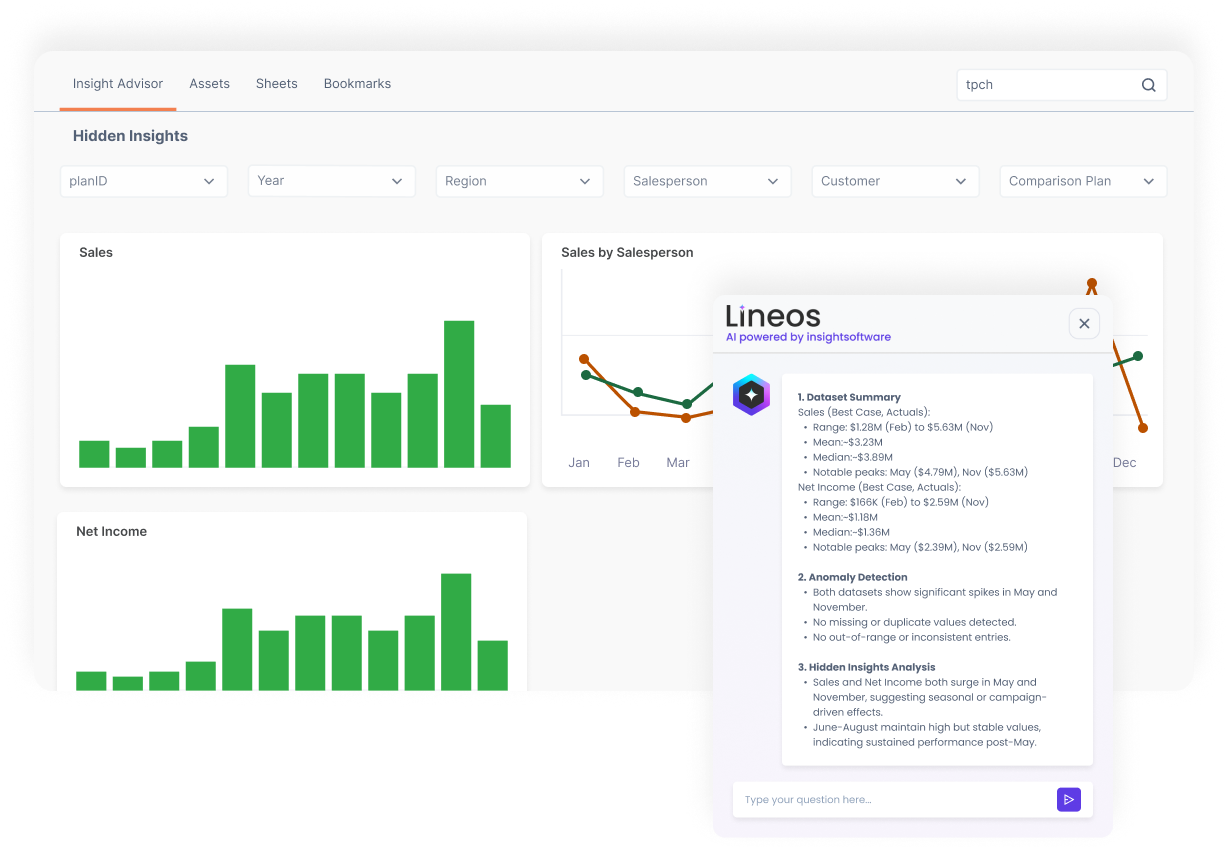
Hidden Insights AI Reveals More
Stop exporting to Excel for answers. Ask Hidden Insights AI anything about your Qlik charts to instantly understand what your data means, compare charts across any timeframe, and discover opportunities hidden by your filters. No waiting for developers-just immediate insights from the data you already have.
Seamless Integration With Your ERP/EPM, Realtime Data Feed & IT-Free Export Features
Connect to 140+ ERPs and EPMs export and view render data without an IT expertise


Vizlib & Qlik Advanced Reporting FAQs
Qlik Sense is an analytics platform where users can explore data relationships across multiple sources. It helps facilitate self-service analytics and reliable governance across apps, sheets, and visualizations. Qlik also has a variety of extensions (such as Vizlib) available to customize and extend your experience with the platform.
You’ll want to start by creating an app and adding data. From there, you can build sheets and drop visualizations onto the canvas (the associative engine keeps your selections in sync across objects). To speed up dashboard creation and standardize user experience, many teams add setup wizards (like the one provided by Vizlib) to guide users through fields, measures, and layouts. This simplifies the process and reduces trial-and-error build processes.
While both are enterprise-focused BI tools, each emphasizes different aspects and functionality. For example, Qlik is selection-driven (meaning that any click becomes a filter), while Power BI is more visualization-driven (slicers, cross-filtering, etc.). This helps Qlik be more effective at data discovery, although its interface can have a steeper learning curve than Power BI. Thankfully, extensions like Vizlib not only bolster functional capabilities, but can also enhance the user experience of Qlik to make it more intuitive, responsive, and engaging.
Common pain points we often hear from Qlik Sense users revolve around limited native chart capabilities. Especially for advanced use cases (e.g. Mekko, ridgeline, rich Gantt, etc.), Qlik doesn’t have the required breadth of options to meet these needs. Qlik also lacks native, governed writeback to operational systems, meaning that most teams end up adding an extension or other solution to handle writeback. Lastly, although Qlik is designed to support self-service analytics, it has fallen behind other tools in this area and can be difficult for non-technical users to create and modify their own dashboards. However, modern extensions like Vizlib can seamlessly plug into Qlik Sense and solve these issues without requiring a platform switch.
The best way to enhance Qlik Sense is with customizable extensions. These add-ons can take Qlik’s capabilities to the next level, breaking down limitations that were previously in place. Instead of switching to an entirely new analytics platform, upgrade Qlik Sense with Vizlib.
Vizlib Library vastly expands the native set of charts with advanced visuals, custom reports, and UX controls. These include rich pivot tables, Mekko charts, ridgeline charts, advanced filters/menus, and design-first KPI objects. Vizlib also provides setup wizards and templates to help analysts build on-brand, insightful, and consistent dashboards faster than ever.
Yes. Using Vizlib Writeback Table and Vizlib Input Form (part of Vizlib Collaboration), users can edit cells, add rows, attach comments, and submit governed changes from within Qlik. Even better, all of these updates maintain audit trails and have configurable destinations.
Yes. Vizlib can create configurable heatmap objects (color scales, labels, interactivity) that work with Qlik selections. This helps users spot density and correlation patterns more efficiently as they explore data.
Learn more about using heatmaps in your Qlik Sense dashboards here.
Beyond heatmaps, Vizlib enables business users to deploy visualizations like Mekko/Marimekko charts, ridgeline plots, rich pivot tables, customizable filters, advanced menus, calendars, and custom KPI dashboards.
Learn more about Vizlib’s Mekko charts, filters, and Calendar visualizations.
Vizlib KPI Designer is an intuitive component for building highly customized, branded KPI objects for Qlik dashboards without needing CSS or custom code. It makes it easy for authors to assemble multiple layers like a design tool (such as text, icons, images, gauges, mini-charts, and more) and apply one-click templates for consistent styling across apps. This is incredibly valuable for executive dashboards, removing all of the hassle of manually updating formatting and visuals.
Vizlib allows users to stack granular layers (e.g. text, icons, images, and mini-charts) as well as control positions and alignment for pixel-perfect results. In Vizlib, you can also trigger global actions (e.g. apply selections or navigate) on a single click and reuse templates to standardize brand and layout across various sheets.
The Vizlib Collaboration module adds in-app features like comments, annotations, governed writeback, and workflows that keep conversations and edits within Qlik. This means that insights, decisions, and context all live together instead of being siloed and potentially disrupting collaboration. Vizlib is purpose-built to fast-track adoption and reduce the time between analysis and action, which relies on more effective collaboration than Qlik natively supports.
Yes. Vizlib supports both Qlik Sense Enterprise (on-premise) and Qlik Cloud. For on-prem, simply install extensions on your Qlik Sense server and manage versions in the QMC. For Qlik Cloud, install and configure Vizlib Server for Qlik Cloud and link it via OAuth/API keys.
The short answer is depth and completeness. Vizlib provides a full suite of tools that span advanced visuals, collaboration, governed writeback, self-service templates, and more. All of this comes with versioned releases, setup wizards, and admin tooling for a more thorough user experience than any other Qlik Sense extension. In addition, it does this while preserving Qlik’s associative experience and governance, so you’re not losing the primary selling points of the Qlik platform — simply building on it.
Yes. Vizlib writeback includes audit trail settings and runs through Vizlib Server, meaning that admins can define granular security rules to restrict actions, like which users can write to which destinations. This secure auditability creates a controlled and traceable path for operational edits.
Vizlib integrates with Qlik Enterprise/Cloud using OAuth/API keys and honors Qlik user context. Vizlib Server then adds its own layer of security rules to further restrict access to writeback resources. For those who use section access or row-level security in their Qlik apps, users can only see the data that their Qlik identity permits.