40+ Manufacturing KPIs and Metrics for Reporting in 2025

Manufacturing today runs on more than just production lines and raw materials. It runs on data. The companies that thrive are the ones that know how to measure, monitor, and act on the right information at the right time.
If you want to drive efficiency, reduce waste, and stay competitive, you need clear visibility into your operations. That’s where manufacturing KPIs come in. These metrics offer critical insights into every part of your production process, from cycle times to inventory turns.
In this guide, we share 40 essential manufacturing KPIs and metrics for 2025 reporting. You will learn what to track, how to calculate each KPI, and how to make smarter, faster decisions by using a manufacturing KPI dashboard designed for real-time insights. Whether you’re building your first dashboard or optimizing an existing one, this post will give you the essential manufacturing KPI examples you need to stay competitive and agile.
What is a Manufacturing KPI?
A manufacturing Key Performance Indicator (KPI) or metric is a well-defined and quantifiable measure that the manufacturing industry uses to gauge its performance over time. Manufacturing companies specifically use KPIs to monitor, analyze, and optimize operations, often comparing their efficiencies to those of competitors in the same sector.
By using a manufacturing KPI dashboard, you can centralize performance tracking and turn complex data into actionable insights. This post not only defines the most important KPIs for manufacturing, but also shares practical formulas, use cases, and a free downloadable dashboard template to help you get started.
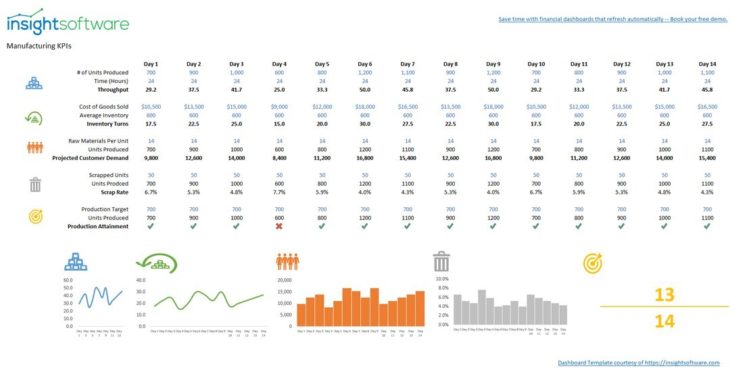
FREE TEMPLATE: Manufacturing KPI Dashboard
Get Your Template Right NowWhy You Need Manufacturing Specific KPIs to Stay Competitive
The manufacturing industry represents more than 10% of the US economy, and more than 15% of the global GDP. The only way to stay ahead in this fiercely competitive industry is through the implementation of manufacturing KPIs and metrics.
Everyone strives to increase the top line of a business, trying to gain more market share in an attempt to increase profits. While this is important, what if you could grow your bottom line without having to take on expansion risks? This is where KPIs for manufacturing come into play.
20+ Fundamental Manufacturing KPIs and Metrics You Need in 2025
When your company is just starting to implement KPIs, the whole concept can seem fairly daunting. Rest assured, it isn’t as bad as you think. Everything can be broken down into smaller, more digestible morsels of information. In this section, we will go over 20 of the basic examples of KPIs in manufacturing that your company should consider using:
1. Throughput
Throughput = # of Units Produced / Time (hour or day)
This is probably one of the most fundamental KPIs for the manufacturing industry, while also arguably one of the most important. The Throughput KPI measures the production capabilities of a machine, line, or plant; also known as how much they can produce over a specified time period.
2. Cycle Time
Cycle time = Process End Time – Process Start Time
The cycle time KPI is very simple in nature, but that doesn’t mean it can’t be manipulated to be a very powerful tool. In the manufacturing industry, cycle time is the average amount of time it takes to produce a product. Simple, right? Maybe not as simple as you think. The cycle time metric can be used to measure the time it takes to manufacture a completed product, each individual component of the final product, or even go as far as to include delivery to the end user. Thus, cycle time can be used to analyze overall efficiency of a manufacturing process on the macro scale, as well as determine inefficiencies on a micro scale.
3. Demand Forecasting
Projected Customer Demand = Raw Materials * Production Rate
This manufacturing metric is used by companies to estimate the amount of raw materials they will require to meet future customer demand. This metric can be a bit trickier for companies to fully utilize, as it is highly dependent on uncontrollable external factors.
4. Inventory Turns
Inventory Turns = Cost of Goods Sold / Avg. Inventory
This is a measure of how many times inventory is sold over a specific time period and helps indicate resource effectiveness and optimal inventory metric performance. Low ratio numbers indicate poor sales and excessive inventory, while high ratio numbers represent strong sales or insufficient inventory.
5. Production Attainment
Production Attainment = # of Periods Production Target Met / Total Time Periods
This production performance metric measures production levels over a specific time period and calculates what percentage of the time a target production level is achieved.
6. Cash to Cash Cycle Time
Cash to Cash Cycle Time = Inventory Sale Date – Inventory Purchase Date
This is a time-based manufacturing KPI metric. It measures the amount of time it takes from an initial cash outlay for raw materials, inventory, or a manufacturing plant until the company receives cash from its customers for its products. This KPI is typically measured in days.
7. Avoided Cost
Avoided Cost = Assumed Repair Cost + Production Losses – Preventive Maintenance Cost
This doesn’t mean you can just avoid paying bills and keep all the profits. The avoided cost manufacturing metric is an estimate of how much money you saved by spending money. Seems strange, right? The most common example is how much money is spent on machine maintenance vs. repair cost if a machine were to break down, plus the lost production value associated with the repair downtime.
8. Changeover Time
Changeover Time = Net Available Time – Production Time
At the most basic level, changeover time represents the amount of time required to switch from one task to another. In manufacturing, it represents the amount of time lost from switching a production line from one product to another. However, it can also represent the amount of time lost during a shift change.
9. Takt Time
Takt Time = Net Available Time / Customer’s Daily Demand
This is a very useful manufacturing KPI when scheduling production orders or deciding whether to take an order from a client. Takt time is the maximum permissible amount of time that can be spent manufacturing a product while still meeting a client’s deadline. For those who are curious, Takt stands for “taktzeit,” a German word meaning “cycle time.” While very similar in nature, this is not to be confused with the cycle time KPI.
10. Return on Assets (ROA)
ROA = Net Income / Avg. Total Assets
You might be thinking, this seems like it has less to do with manufacturing and more to do with finance. That is because it does. However, financial metrics are just as important as manufacturing metrics. You can’t have a business if you aren’t making money. This metric evaluates how well your business is making use of its assets (money). It is the annual net income divided by total assets (fixed assets + working capital).
11. Production Volume
Measure and document the total output your production processes can achieve. This involves maintaining a detailed log of all items manufactured during a given period.
12. Production Downtime
Scrutinize maintenance records and procedures to identify areas for improvement. The goal is to minimize the time when production equipment is not operational due to maintenance or failures.
13. Production Costs
Track all financial expenditures involved in the manufacturing process, including materials, labor, and overhead. This tracking is crucial for budgeting and for identifying potential savings in the production line.
14. Overall Operations Effectiveness (OOE)
Conduct a comprehensive analysis of your production efficiency, taking into account availability, performance, and quality. By evaluating OOE, you can pinpoint operational strengths and areas that need strategic improvement.
15. Total Effective Equipment Performance (TEEP)
Monitor the absolute effectiveness of your machinery, considering both its operational and non-operational time. This metric is essential for understanding the full potential of your equipment across all shifts, including downtime for maintenance and other pauses in production.
16. Defect Density
Record and evaluate the frequency of defects in the products you produce as soon as they occur. By monitoring defect density, you can identify quality issues promptly and implement corrective measures to maintain product integrity.
17. Rate of Return
Calculate the proportion of products that are returned by customers, which serves as an important indicator of customer satisfaction and product quality. This measure helps in understanding the reasons behind returns and in devising strategies to reduce them.
18. Right First Time
Gauge the effectiveness of your production process by determining the percentage of products that meet quality standards on the first attempt without the need for rework. This key performance indicator reflects the precision and reliability of your production line.
19. Asset Turnover
Recognize the efficiency with which your company uses its assets to generate revenue. This ratio compares the value of your sales to the value of your assets, indicating how well your resources are being utilized to produce income.
20. Unit Costs
Monitor and incrementally adjust the cost associated with producing each unit over time. This involves not only tracking direct expenses like materials and labor, but also allocating overhead costs effectively to ensure competitive pricing and profitability.
21. Revenue Per Employee
Evaluate the average revenue generated by each employee, which provides insight into the overall productivity and efficiency of your workforce. This metric can help you identify the return on investment in human capital and inform workforce planning and development strategies. It is key to note that these are just the basic KPIs used in the manufacturing industry. A company should look beyond these for more insight into its production practices.
How to Build Useful KPI Dashboards
Get our in-depth PDF nowWhat Makes the Best Manufacturing KPI Metrics?
There is a plethora of manufacturing metrics and KPIs considered to be standard practice throughout the industry. However, that doesn’t mean that they should all be applied to any company that produces a product. While many of them are applicable, some are not. There might even be the possibility that a standard manufacturing metric doesn’t even exist for what you want to measure. If you are going to create your own production metric, there are some things you should take into consideration.
- Every KPI needs a clearly defined goal. What are you trying to achieve? Is it even something that can be achieved? What is the time period that you wish to achieve this goal? Be specific and set up parameters that clearly define your goal. This goal needs to be something that can be numerically defined (quantitative, not qualitative).
- It is very important that you are able to objectively measure your progress toward the goal. This means collecting and interpreting data. Which brings us to the next criterion.
- Data, data, data. There must be a clearly defined data source with a strict procedure for how the data is measured or collected. There should be nothing left to interpretation here.
- Reporting your data is just as important as collecting it. Different manufacturing KPIs will have different reporting frequencies. Typically, reporting should happen on a weekly or monthly basis, and will often make use of a manufacturing reporting software solution.
Now that we have gone over some basic KPIs for manufacturing and have a grasp of what makes a good KPI, we can dig a bit deeper into the world of manufacturing KPIs and explore lean manufacturing KPIs.
10+ Lean Manufacturing KPIs to Know
Lean manufacturing is a practice of Japanese origin (namedrop: Toyota) whereby companies attempt to minimize the amount of “waste” without sacrificing productivity. “Waste” in this situation doesn’t mean garbage or refuge from the production process. It actually represents any activity that does not add value from a customer’s perspective. Listed below are 10 KPI metrics examples for lean manufacturing:
22. Machine Downtime Rate
Machine Downtime Rate = Downtime Hours / (Downtime Hours + Operational Hours)
While this is commonly used as a manufacturing metric to give a general snapshot of how the operation is going, it doesn’t paint a full picture. Machine downtime is a combination of both scheduled downtime and unscheduled downtime.
23. Percentage Planned Maintenance
PPM = (# Planned Maintenance Hours * 100) / # Total Maintenance Hours
This production metric is used to analyze the ratio of scheduled maintenance against the unscheduled maintenance. This KPI is useful in identifying when more preventative maintenance is required for certain assets.
24. Downtime to Operating Time
Downtime to Operating Time = Downtime / Operating Time
This manufacturing metric can be used to measure the effectiveness of machinery maintenance and the machine itself. With effective preventative maintenance, the amount of downtime can be reduced, creating a more optimal manufacturing process. Companies aspire to reduce this ratio as much as possible.
25. Capacity Utilization
Capacity Utilization = Actual Factory Utilization / Total Productive Capacity
This production KPI measures the amount of capacity being utilized as a function of total capacity available. Ideally, companies want this number to be as high as possible, as it indicates they are making better use of their production capabilities and maximizing return on their assets. This metric can also be used by management when deciding whether to take on new orders or quote lead time, as it gives a snapshot of available resources.
26. First Pass Yield
First Pass Yield Rate = Quality Units / Total Units Produced
This is one of the most fundamental production KPIs. It calculates the percentage of products manufactured to specification the first time through the process. This means that they do not require any rework or become scrap. A higher FPY rate is very desirable for any company.
27. Overall Equipment Effectiveness (OEE)
OEE = Availability * Performance * Quality
This key performance indicator is considered the gold standard for measuring manufacturing productivity. The higher your OEE, the more effective your equipment is. A score of 100 percent means that you are manufacturing 100 percent of the time, at 100 percent capacity, at a 100 percent yield (no defective parts).
28. Manufacturing Cost Per Unit
Manufacturing Cost Per Unit = Total Manufacturing Cost / # of Units Produced
It is very important that you know the total cost associated with manufacturing a product on a per-unit basis. Without it, you wouldn’t be able to price a product properly. This KPI takes into account all costs associated with production and divides the cost by the number of units manufactured. Typical costs include materials, overhead, depreciation, labor, etc.
29. Material Yield Variance
Material Yield Variance = Actual Material Use / Expected Material Use
This lean manufacturing KPI takes the estimated amount of material required for a product and compares it against the amount of material actually used.
30. Maintenance Cost Per Unit
Maintenance Cost Per Unit = Total Maintenance Cost / # of Units Produced
This production metric is often overlooked as people tend to consider maintenance costs to be an overhead item. However, it is an important lean manufacturing KPI to take into consideration when trying to optimize efficiency. This calculation takes the total cost of maintenance (both preventative and emergency) and divides it by the number of units produced for a specified time period.
31. Overtime Rate
Overtime Rate (Percentage) = (Overtime Hours * 100) / Regular Hours
This metric compares the amount of overtime worked by employees to the amount of standard hours. It helps to identify inefficiencies in scheduling and/or staffing.
10 More Examples of Manufacturing KPI Metrics
Here are 10 additional examples of manufacturing KPI metrics that might take you by surprise:
32. On-Time Delivery
On-Time Delivery = (# Units Delivered On-Time * 100) / # Units Delivered
This is less of a production performance metric, but a very important KPI in the manufacturing sector nonetheless. You can have the most efficient production line in the world, but if you can’t deliver on time, clients are not going to want to work with you, thus affecting logistics KPIs. This metric measures the percentage of products delivered on time to clients.
33. Health and Safety Incidence Rate
Health and Safety Incidence Rate = (Number of Incidences * 200,000) / # hours worked by all employees
In an ideal world, this manufacturing metric would not even exist because it would be zero. Unfortunately, the reality of the matter is that workplace accidents and near misses do occur. This metric monitors the number of incidents or near misses over a given period of time (normally per annum).
34. Employee Turnover
Employee Turnover Rate (%) = (Employees who left * 100) / Avg. # of Employees
While this metric isn’t manufacturing-specific, it is as equally critical as the other KPIs in this list. While employee turnover typically has a negative connotation associated with it, not all turnover is bad. Some turnover may be required to remove underperformers and replace them with higher performers. However, having too high of a turnover can lead to lower morale.
35. Non-Compliance Events / Year
Non-Compliance Events = # of Non-Compliance Events / Specified Period of Time (Annually)
Every country has regulatory compliance rules that manufacturers must follow when producing their products, whether it be safety, emissions, or something else. Not only is it important to record the number of times a non-compliance event occurred, it is also good practice to document the reason it occurred, and what the resolution was.
36. Customer Returns (Rejects)
Customer Return Rate = (# of Products Returned * 100) / Total # of Products Shipped
This is a classic example of a KPI used in manufacturing, and it is still used to this day for a reason. Keeping track of returns is imperative. This metric calculates the percentage of products that customers return because they have received a bad product. Needless to say, a company should strive for the lowest percentage possible.
37. Total Manufacturing Cost Per Unit Excluding Materials
TMC Per Unit Ex Materials = TMC Per Unit – Material Cost Per Unit
This is a performance metric that attempts to pin down the fixed costs associated with operating a factory or production line. These are arguably the costs that companies are able to control.
38. Manufacturing Cost as a Percentage of Revenue
Manufacturing Cost as a Percentage of Revenue = Total Manufacturing Cost / Total Revenue
This manufacturing KPI will help bring insight into how much your company is spending on manufacturing with respect to total revenue. This is very useful data to compare against competitors in the same sector.
39. Energy Cost Per Unit
Energy Cost Per Unit = Total Energy Cost / # of Units Produced
This is a fairly nitty-gritty manufacturing KPI that a lot of companies tend to overlook. It only really comes into play when companies are fine-tuning their operations and trying to become leaner. This KPI takes the total cost of energy spent over a period of time and divides it by the number of units produced in that time frame.
40. Work-in-Process
Ending Work-in-Process = Beginning WIP + Manufacturing Costs – Cost of Goods Manufactured
This manufacturing KPI metric measures the value of partially completed products. It helps manufacturing companies understand how much of their working capital is tied up in incomplete products, and can help identify supply chain management issues.
41. Scrap Rate
Scrap Rate = # of Scrap Units / Total # of Units
This is a fairly straightforward manufacturing KPI. It keeps track of the number of products that are deemed scrap due to manufacturing defects that can’t be reworked. It gives companies insight into the ratio of products deemed scrap in a production run, helping identify an inefficient process.
We have covered 40+ different manufacturing KPI, metrics, and examples at this point, as well as what it takes to make your own. Now it is time to look at some data management best practices.
How to Keep Track of Your KPI Data
Quality control and process management are not the most exciting things going on at a manufacturing company, but they are the backbone of the operation. After companies start to implement their newly created KPIs and metrics, they often keep track of the collected data using Excel (hopefully no one is still compiling data using a ledger book). However, there are a couple of things to take into consideration when managing your data:
- Data protection and security are essential. Hackers stealing your KPI data is probably not a huge concern. However, it is critical that your data is backed up and can’t be deleted by accident.
- Reduce the amount of duplicate data. Don’t keep multiple working copies of the same data. Have one working copy, and one unaltered backup.
- Ensure your KPI data are easily accessible to your team. There is nothing worse than not being able to do your work because you don’t have access to information that you need.
All of these concerns can actually be remedied through the use of a reporting solution. Here at insightsoftware, we build industry-leading reporting software solutions. Come and see how our KPI dashboards can help your company get ahead of the curve.
How to Compare KPI Reporting & BI Solutions
Instantly download for free nowStreamline Your Reporting with Manufacturing Reporting Software
Regardless of whether your manufacturing company is large or small, using a manufacturing KPI dashboard can help with the following reporting processes:
- Managing large data dumps manually is an inefficient process. A manufacturing dashboard is able to automatically process collected data and turn the data into analytics and insights.
- Consolidating the data into a central location can take a long time. Manufacturing reporting software allows companies to input all of their information into a single centralized location.
- Interface with other services. Manufacturing reporting solutions have developed over time to become powerful tools. Any good business intelligence software will be able to interface with your favorite ERP software.
- Instant updates at your fingertips. Gone are the days of asking someone to bring you weekly data updates from different segments of the company. Everything you need is just one click away. With a centralized database, manufacturing KPI dashboards can immediately generate reports on performance, as well as send you alerts when a KPI starts to underperform.
Having a manufacturing reporting solution is a crucial aspect of operating a company in the industry. Centralized data with real-time reporting will give any company the potential edge required to stay ahead of their competitors. However, it is important to remember that KPIs aren’t a one-time set-and-forget. They will require updating as your business grows and expands. Sometimes, there are metrics that you don’t think of when someone says manufacturing.
Turn Manufacturing KPIs into Measurable Impact with insightsoftware
Congratulations! You’ve explored the top 40 manufacturing KPIs to use in your 2025 reporting, learned how to create metrics tailored to your operations, and discovered how to manage performance data more effectively. These KPIs are powerful tools, but only if you can access, track, and act on them in real time.
That’s where insightsoftware comes in. Our business intelligence and reporting solutions are designed for manufacturers who need more than just spreadsheets. With an intuitive manufacturing KPI dashboard, seamless ERP integration, and AI-driven insights, we help you move from data collection to confident decision-making.
Whether you’re optimizing a single plant or managing global operations, insightsoftware helps turn your manufacturing KPIs into a competitive edge. Ready to see it in action? Contact us today to speak with one of our reporting and KPI experts.

5 Things Not to do When Choosing a KPI Reporting Tool
Download Now:
Manufacturing KPIs FAQ
Manufacturing productivity is typically calculated by dividing total output by total input. A higher ratio means greater efficiency. It can be measured through different approaches depending on what inputs are being analyzed.
Key formulas and metrics
• Basic Productivity: Total Output ÷ Total Input
• Labor Productivity: Total Output ÷ Total Labor Hours
Example: 10,000 units ÷ 5,000 hours = 2 units per hour
• Multi-Factor Productivity: Total Output ÷ (Labor + Material + Capital + Other Inputs)
• Overall Equipment Effectiveness (OEE): Availability × Performance × Quality
Additional metrics
• Capital Productivity: Output ÷ Units of Capital Used
• Capacity Utilization: Percentage of production capacity in use
• Inventory Turns: Frequency inventory is sold and replaced
• On-Time Delivery: Percentage of orders shipped by their promised date
How to implement
-
Define your inputs and outputs (e.g., labor, materials, or revenue).
-
Use consistent units of measurement.
-
Gather accurate data.
-
Apply the chosen formula.
-
Analyze results to target efficiency improvements.
Manufacturing activity is measured through a set of key performance indicators (KPIs) that track how efficiently and effectively production operations are running. These metrics provide a quantifiable view of output, quality, and resource utilization, helping manufacturers evaluate performance and identify areas for improvement.
Common ways to measure manufacturing activity
• Production Output: Tracks the total number of goods produced over a specific period.
• Cycle Time: Measures how long it takes to complete one production cycle from start to finish.
• Overall Equipment Effectiveness (OEE): Combines availability, performance, and quality to assess equipment productivity.
• Yield Rate: Indicates the percentage of products that meet quality standards without rework.
• Capacity Utilization: Shows how much of the available production capacity is being used.
• Downtime: Captures unplanned stoppages that affect throughput and efficiency.
Together, these metrics give a comprehensive view of manufacturing activity, revealing how well processes convert inputs into finished goods and how effectively resources are managed.
Quality in manufacturing is measured using specific metrics that assess how well products meet design standards, customer expectations, and production efficiency goals. These indicators help identify defects, reduce waste, and ensure consistent output across processes and suppliers.
Top metrics to measure manufacturing quality
• First Pass Yield (FPY): Calculates the percentage of products that meet quality standards without needing rework, reflecting overall process efficiency.
• Scrap Rate: Measures the proportion of materials or units discarded due to defects or errors during production.
• Supplier Defect Rate: Tracks the percentage of defective parts or materials received from suppliers, helping assess supplier reliability.
• Cost of Quality (CoQ): Evaluates the total cost of maintaining quality, including prevention, appraisal, and failure-related expenses.
• Return Material Authorizations (RMAs) and Returns: Indicates the number of products returned by customers due to defects or performance issues.
Together, these metrics provide a clear picture of manufacturing quality, enabling companies to maintain high standards, minimize waste, and enhance customer satisfaction.
Imagine your production line turns out 500 units in one week. The next week, you ramp up and produce 700 units in the same amount of time. That increase of 200 units shows higher productivity, you’re producing more output without extending the time frame.
OTIF, or On-Time In-Full, is a key performance metric in manufacturing and supply chain management. It tracks the percentage of customer orders delivered both on schedule and with the full quantity requested. This measure reflects how reliable and efficient a supplier is, with higher OTIF scores signaling stronger operations and greater customer satisfaction.
Key components
• On-Time: Evaluates whether deliveries arrive by the promised date and time.
• In-Full: Confirms that the customer receives every item and quantity specified in the order.
Why OTIF Matters in Manufacturing
A strong OTIF performance is critical for maintaining customer trust and operational excellence.
• It clearly reflects supplier reliability and efficiency across production and logistics.
• Consistently meeting time and quantity commitments boosts customer loyalty.
• Late or incomplete deliveries can lead to retailer penalties, rush shipping costs, and lost revenue.
• A low OTIF score may reveal weaknesses in forecasting, scheduling, or distribution that need improvement.
• Industries using just-in-time (JIT) systems—such as automotive and food production—depend heavily on OTIF to avoid production delays and inventory shortages.
How to Calculate OTIF
OTIF is calculated by dividing the number of deliveries that were both on time and complete by the total number of deliveries, then multiplying by 100 to express it as a percentage:
OTIF = (Deliveries On Time and In Full ÷ Total Deliveries) × 100