Operational Analytics Solutions
Optimize Data Access and Oversight for Agile Operational Reporting
Our solutions put the power of operational analytics and business intelligence into the hands of the people who need it most – your business users.
"*" indicates required fields
Deliver Actionable Insights From Your ERP
Small or large, Oracle or SAP. Our operational analytics solutions cater to all businesses, offering deep and intuitive operational reporting functionality.
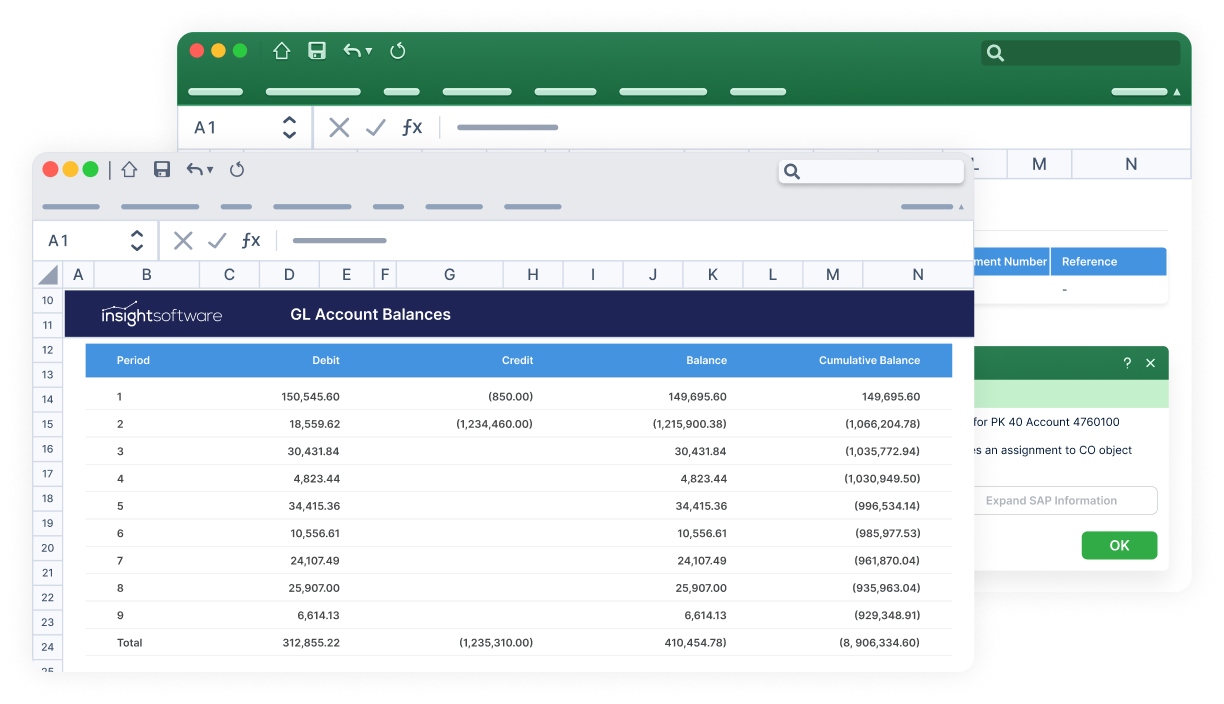
Financial Optimization for SAP
insightsoftware Financial Optimization for SAP bridges the SAP to Excel gap with user friendly process automation, data validation, and deeper insights.
Reporting for Oracle
insightsoftware Reporting for Oracle offers deeper insights from Oracle ERP data with pre-built views and self-serve reporting in Excel, Web, or Power BI.

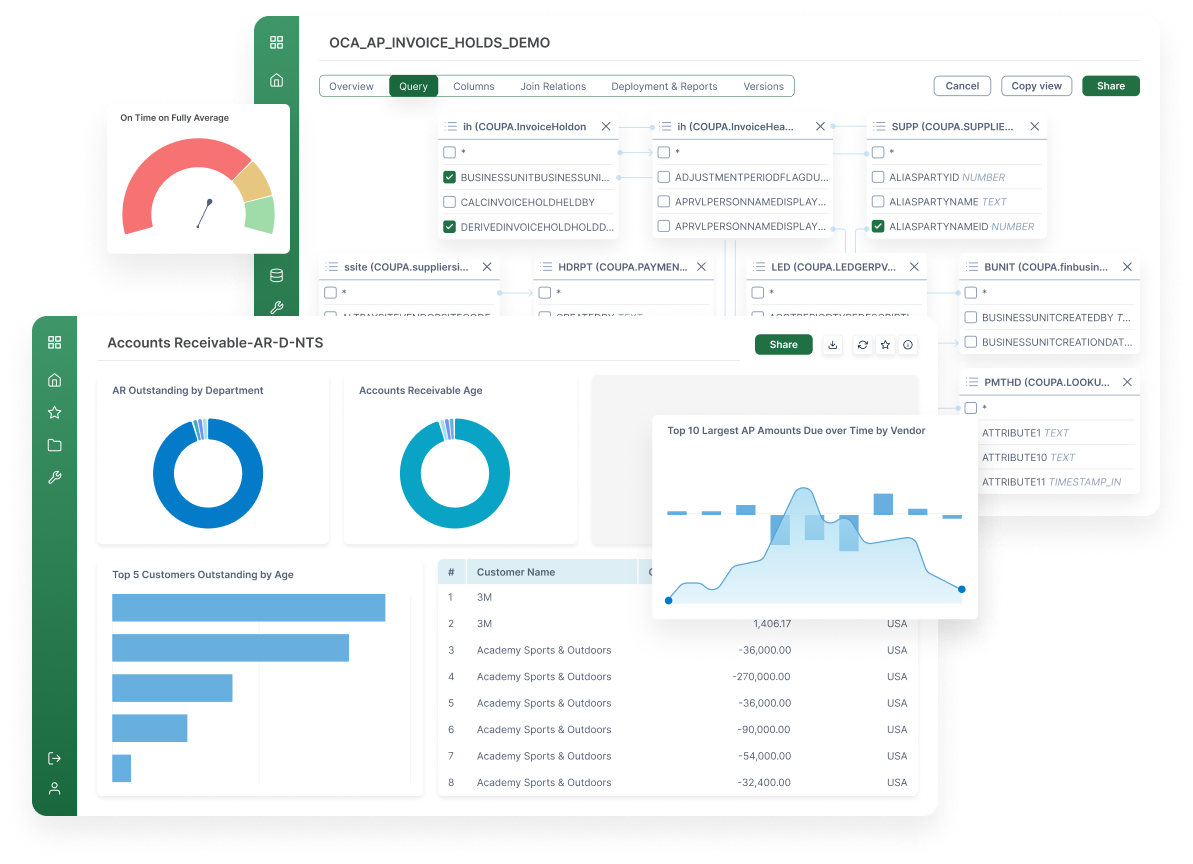
Operational Reporting for Oracle EBS and OCA
Angles Enterprise for Oracle unlocks powerful insights in your chosen BI tool. 1,800 pre-built, no-code business reports deliver actionable insights.

Operational Reporting for SAP ECC and S/4HANA
Angles Enterprise for SAP transforms critical operational data into actionable insights, with 600+ calculated fields enriching your supply chain data.
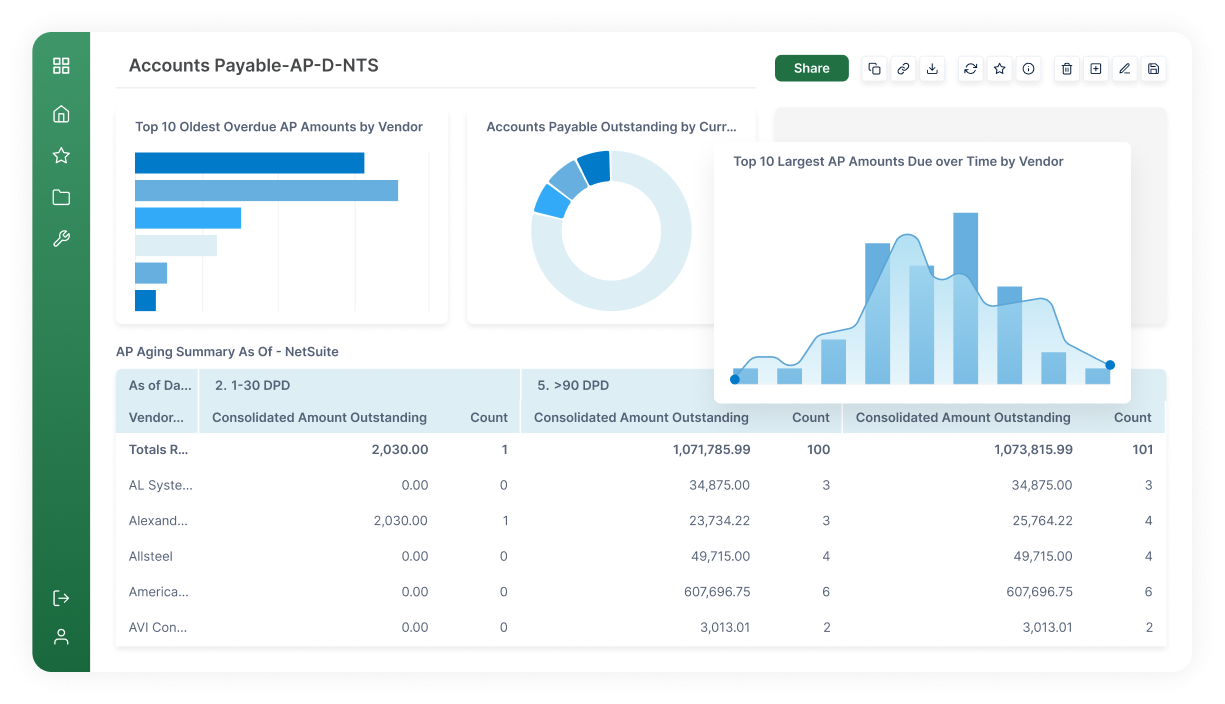
Operational Reporting and Distribution
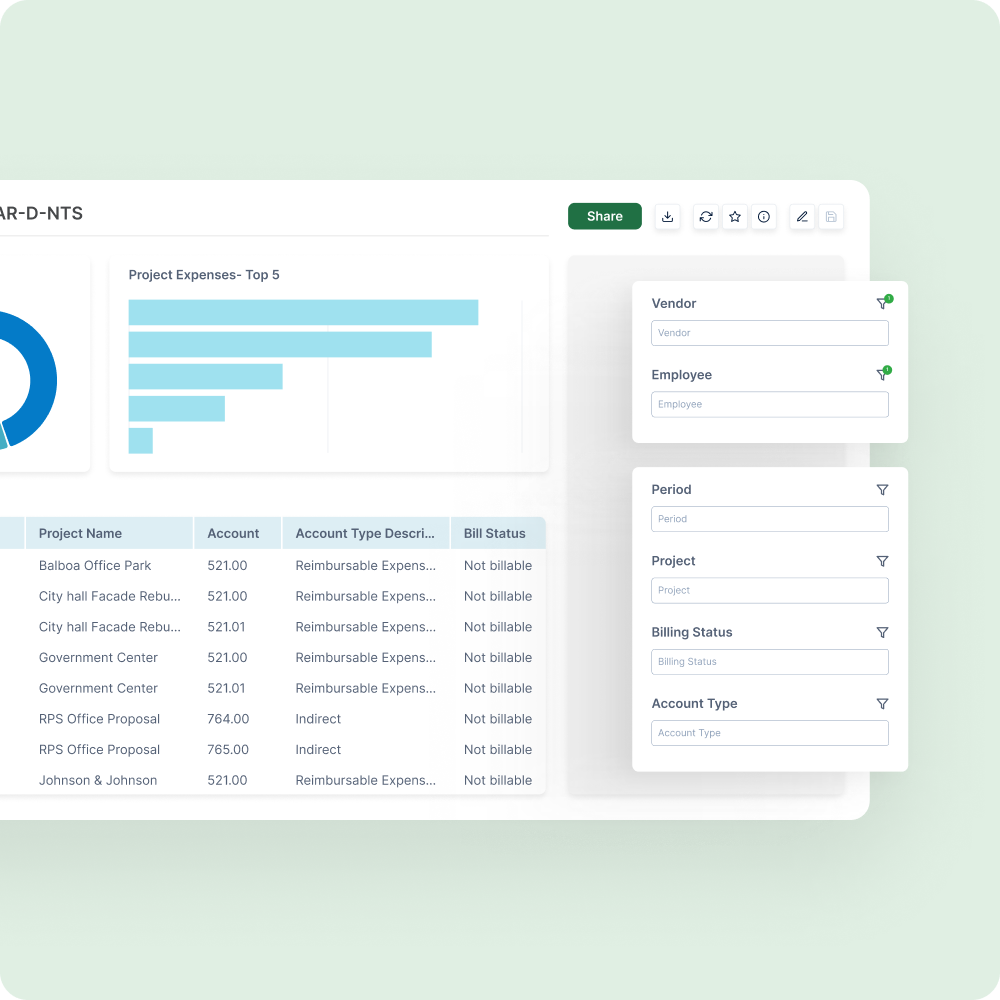
Angles Professional streamlines the creation and distribution of operational insights with pre-built content for Deltek, NetSuite, Oracle EBS/Fusion Cloud ERP.
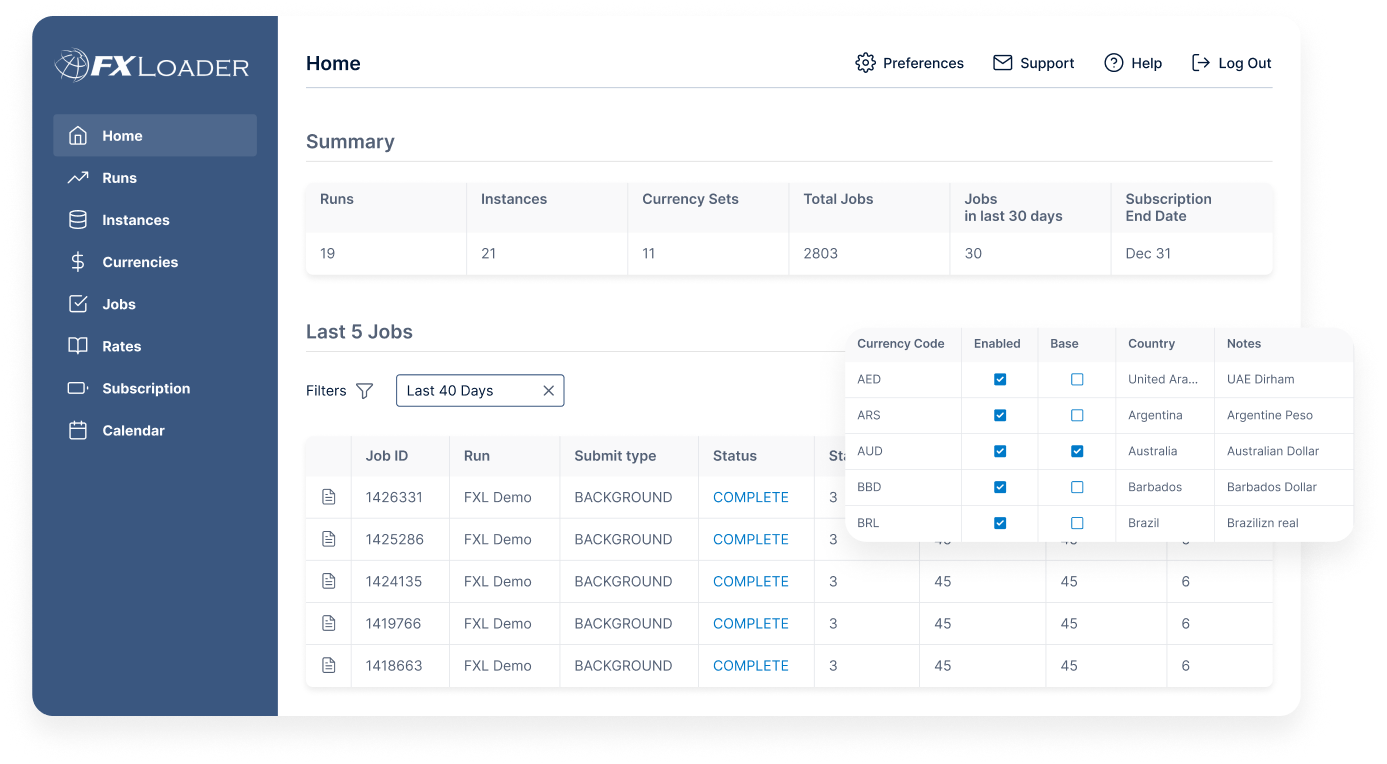
Automated Currency Rate Management
FXLoader ensures accurate, compliant foreign exchange rate management by automatically fetching and incorporating rates from trusted sources seamlessly with your existing systems.
Actionable Operational Insights Directly From Your ERP Data
Reveal answers to critical business questions with easy-to-use operational reporting solutions built to support multiple data sources, including over 140 ERPs. Business users can easily customize, create, and share rich, highly interactive operational reports and dashboards, without depending on IT.
We Connect to 200+ ERPs/EPMs


Understand Your Operations in a Way You Never Have Before
It can be challenging to generate the actionable operations insights your business needs to inform strategic decision-making. Fortunately, our solutions simplify the process and eliminate these data headaches.

Improve your supply chain processes by analyzing operational data related to inventory levels, supplier performance, logistics, and demand forecasting. insightsoftware operational analytics solutions enable your team to identify inefficiencies, reduce costs, improve order fulfillment, and enhance overall supply chain management.
Optimize manufacturing processes by analyzing operational data from production lines, equipment sensors, and quality control systems. Proactively identify bottlenecks so that you can upgrade production schedules, minimize downtime, enhance product quality, and streamline operations for increased efficiency.
Analyze customer service data to identify patterns and trends to improve customer service performance. insightsoftware operational analytics solutions enhance response times, pinpoint areas for training and improvement, and personalize your customer interactions for increased satisfaction and loyalty.
Compile operational data from multiple sources into comprehensive and accurate reports to analyze and improve processes. insightsoftware operational analytics solutions build trust in the financial data used across your business for enhanced cross-team collaboration and planning.
Evaluate operational data from various sources such as incident reports, safety records, and compliance data to identify risks before they happen. Proactively develop risk mitigation strategies and improve overall operational resilience.
Identify and head off IT bottlenecks by analyzing operational data from servers, network devices, and applications. insightsoftware operational analytics solutions enable consistent performance monitoring to identify bottlenecks, predict equipment failures, optimize resource allocation, and ensure the smooth operation of your critical IT systems.
Track KPIs, analyze customer behavior and preferences, optimize marketing campaigns, and improve sales forecasting accuracy to gain a competitive advantage. Create more targeted marketing efforts, increase conversion rates, and improve sales outcomes.
See for yourself why 500K+ users are using insightsoftware to draw instant data insights, react swiftly to market changes, and outpace their competition
Solutions to Meet Your Unique Operational Reporting Needs
Whatever your industry or role, our deep ERP and industry knowledge allow us to build operational reporting and analytics tools to fit your specific needs.

CEO/CFO/COO
Improve business efficiency by providing standardized, cost-effective operational and analytical reporting. By deploying this enterprise-wide, your organization can monitor, report on, and improve financial and operational processes, supply chain, sales and marketing, and customer support.

BI Manager
Pull and organize reports from multiple data sources without hours of manual lookups and constantly updating that data. With one version of the truth that combines your information sources into a unified view, you can quickly report on financial and business operations.

Data Architect
Organize disparate systems, clean up your data, or pull reports faster. Our operational analytics solutions give you the power to control your company’s data while securely giving more departments access to the vital insights relevant to them.

Supply Chain Manager
Stay agile in today’s challenging and evolving environment. Using data systems that allow you to quickly make changes can often be the difference in delivering orders on time and getting your product to market.

LOB Manager
Gain access to real-time, accurate, functional views of transactional data to understand supply and demand, perform accurate and actionable forecasting, and manage operational efficiency.

IT Manager
Implement a fast time-to-value, cost-effective, secure solution that leverages existing BI investments and reduces the growing burden of report creation or modification requests on their teams from the wider organization.
Finance Director
Get access to an operational reporting solution that makes it easy for business users to share data (like weekly forecasting) within and beyond finance. Even better, all of this uses familiar, self-service tools to minimize learning curves and bottlenecks.

Manufacturing
Reduce bottlenecks and keep consistent product information on file in case you need to report on production. Enhance visibility and control over inventory, cost of goods sold, and gross margin to drive productivity.

Electronics
Constant access to data across applications and platforms can be a difficult task to manage for electronics companies looking to deliver the highest levels of performance and speed to customers. With data connectivity and interoperability, tech leaders can stay ahead of the competition.

Financial Services
Gain actionable insights to manage operational risk, ensuring compliance with evolving regulations. Additionally, optimize resource allocation and analyze profitability for more informed decision-making.

Retail
Effortlessly track key operational metrics such as sales, inventory, expenses, and cash flow. Timely data and analytics empower your team to improve customer satisfaction, loyalty, and retention backed by data-driven insights.

Oil & Energy
Use analytics to predict and adapt to rapidly changing market conditions. Your users can build comprehensive reports from base rates to infrastructure depreciation to quickly respond to requests for data.
Webinars & Resources
Take a look at our upcoming and on- demand webinars packed with handy tips, best practices, and insights, brought to you by insightsoftware’s product and solution experts.

Operational Reporting: Trends, Challenges, and the Key to Success

Angles for SAP Best Practices: Process Mining 101

Enhance Your Cloud Experience With Angles Enterprise for Oracle Cloud Applications
Operational Analytics & Reporting FAQs
Operational analytics is the practice of gathering, processing, and visualizing day-to-day business operations data. This might include sales transactions, inventory movements, or production runs, all to inform decisions. Operational reporting gathers data from specific products, programs, or services to provide a snapshot of business performance with an emphasis on freshness and context, so you’re looking at what just happened or is happening now.
One of the primary differentiators of operational analytics and dashboards is their timeliness. Real-time data of what is happening day-to-day is fed into these systems, where it’s processed and displayed in a matter of seconds. This makes it possible for your team to rapidly respond to changing conditions like spikes in demand or production delays. Because of this pipeline, the actionability and event-driven insights further make operational analytics unique, providing reports, notifications, and other dashboards for frontline teams to act on immediately. These simply aren’t possible with other types of analytics that focus on historic performance.
Operational analytics can help you achieve faster decision cycles as real-time visibility empowers teams to quickly pivot if needed and minimize downtime. These solutions also reduce manual effort by automating data feeds and report generation so your team doesn’t have to wrangle spreadsheets every time something comes up. Not only do the programmed alerts improve proactive risk management, but they keep all stakeholders in the loop and on the same page.
Several functions and features of operational analytics solutions help transition your team from reactive to proactive. For example, automated alerts like threshold-based emails or dashboard flags prompt immediate action when metrics deviate from expected ranges. Built-in what-if scenario modeling, like that offered by Power ON, can highlight potential bottlenecks before they happen, while embedded dashboard collaboration facilitates cross-team discussions in the same environment where data is displayed.
Look for features such as monitoring and alerts, context-aware insights, custom dashboards, various visualization options, process optimization, and bottleneck or silo identification. Additional capabilities of a strong operational analytics solution include live data connections, self-service report creation, scheduled report distribution, interactive dashboard elements, and role-based access.
This depends on the platform you use, but insightsoftware provides wide-ranging capabilities for customization by user roles. Our solutions can parameterize data slices (for specific regions, product lines, etc.) to tailor reports to certain users or teams. They can also help different user roles build dashboards from pre-built layout libraries that already match your branding. Using our data connectors and role-based permissions, you can customize who sees what and how that information is displayed, all in an easy-to-use interface.
Operational analytics and reporting have some key differences from traditional business intelligence that make it more effective for fast-paced modern businesses:
| Aspect | Operational Analytics | Traditional BI |
| Data Latency | Seconds to minutes | Hours to days |
| Users | Frontline managers, supervisors, operations teams | Executives, analysts, strategic planners |
| Focus | Real-time thresholds, alerts, event response | Historical trends, strategic KPIs, annual planning |
To assess the quantitative value of operational analytics’ impact, monitor factors like cycle-time reduction (track time saved from alert-driven actions) and error resolution reduction (manual correction hours before and after automation). You could also calculate the avoided stockouts, overtime costs, or expedited shipping fees as a result of early warnings. Incremental sales that came from seizing real-time demand spikes can further be incorporated into your ROI calculation to determine a quantitative business impact.
Power ON is one of our primary tools used for operational analytics because of its ability to write-back data directly within Power BI. This turns Power BI into a real-time operational reporting workspace, complete with real-time data connections, workflow management, and more — all of which are great for operational reporting. Jet Analytics is another operational analytics solution, automating ETL and cube-building processes to create a single source of truth. This warehousing software enables operational teams to get fast-refreshing dashboards for up-to-the-minute data.