Benchmarking Financial Performance Ratios

How well is your organization performing? The answer depends on what you are measuring performance against and the financial performance metrics you are using. What’s the target? Are you above par, or below? Most businesses set targets on at least an annual basis, but external events beyond management’s control drive a great deal of variability. That was certainly the case in 2020 as the coronavirus pandemic upended virtually everything. Under normal circumstances, the world is not as volatile as that, but fluctuating prices, competitive pressures, variability in demand, and other factors still come into play.
The simple question “How well are we performing?” can quickly become a subject of much debate. Business leaders who define rigid targets risk passing judgment on decisions and managers that don’t adequately reflect the reality at street level. Those who make generous allowances, on the other hand, fail to adequately instill accountability within their organizations. Defining success and failure is notoriously difficult, and trying to quantify and qualify it within dynamic organizations isn’t any easier.
Financial ratios provide a good starting point for defining performance metrics, though, because they generally incorporate broad swaths of data into a single, easily understood metric. Certain ratios bring the realities of enterprise performance into stark relief, and benchmarking how those ratios change from month to month makes performance measures explicit and easily discernible, both the good and the bad.
What are Financial Performance Ratios?
Financial performance ratios are key metrics used to evaluate and compare the financial health and operational efficiency of a business. These ratios are derived from a company’s financial statements, such as the income statement, balance sheet, and cash flow statement, and they provide insights into various aspects of the company’s performance, including profitability, liquidity, leverage, and efficiency.
1. Profitability Ratios
Profitability ratios measure a company’s ability to generate income relative to its revenue, assets, equity, or other financial metrics. Common profitability ratios include the Net Profit Margin, which shows how much profit a company makes for every dollar of revenue, and the Return on Assets (ROA), which indicates how efficiently a company is using its assets to generate profits.
2. Liquidity Ratios
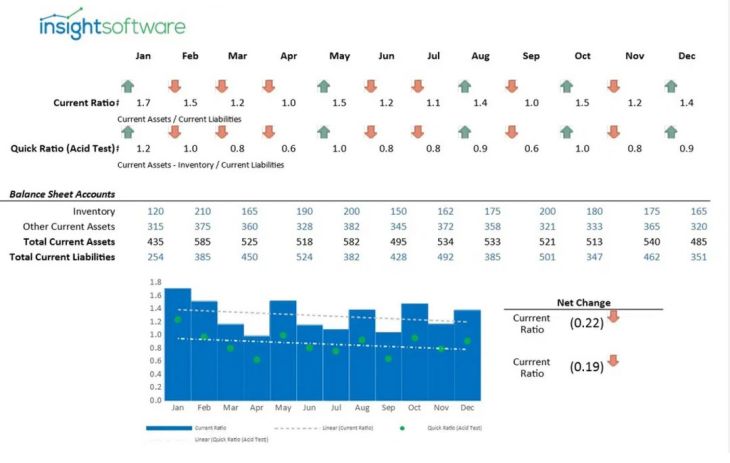
Liquidity ratios assess a company’s ability to meet its short-term obligations using its most liquid assets. The Current Ratio and Quick Ratio are typical liquidity ratios, with the former comparing current assets to current liabilities and the latter excluding inventory from current assets for a more stringent measure.
3. Leverage Ratios
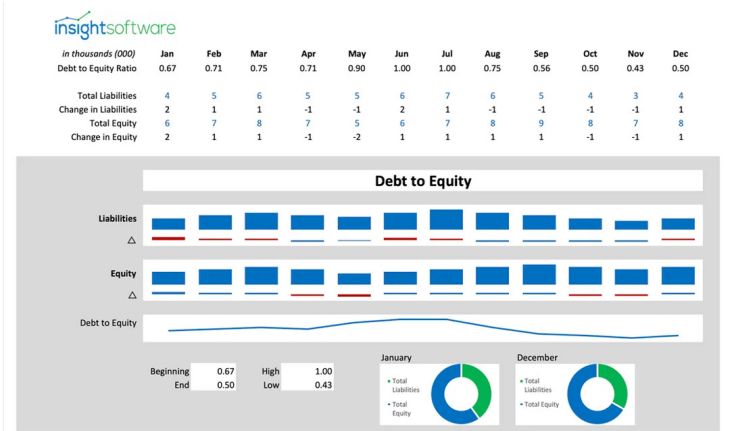
Also known as solvency ratios, leverage ratios evaluate a company’s use of debt relative to equity and its ability to meet long-term obligations. The Debt-to-Equity Ratio is a common leverage ratio, indicating the proportion of debt financing relative to shareholders’ equity.
4. Efficiency Ratios
Efficiency ratios measure how effectively a company uses its assets and manages its operations. The Inventory Turnover Ratio shows how quickly inventory is sold and replaced over a period, while the Asset Turnover Ratio indicates how efficiently a company uses its assets to generate revenue.
5. Market Value Ratios
Market value ratios provide insights into the valuation of a company’s shares in the market, often used by investors to assess the attractiveness of a stock. The Price-to-Earnings (P/E) Ratio is a widely used market value ratio, reflecting investor expectations of a company’s future earnings growth.
Financial performance ratios are vital tools for investors, analysts, and managers to understand a company’s financial strengths and weaknesses, compare it with peers, and make informed decisions about investments, operations, and strategy. By regularly analyzing these ratios, businesses can monitor their financial health, identify trends, and take proactive steps to improve their performance.
What is Financial Ratio Analysis?
Financial Ratio Analysis is a method used to evaluate the financial performance and condition of a business by analyzing various financial ratios derived from its financial statements. These ratios provide a quantitative basis for assessing different aspects of a company’s operations, including profitability, liquidity, solvency, and efficiency. By comparing these ratios over time or against industry benchmarks, analysts, investors, and managers can gain insights into a company’s strengths, weaknesses, and overall financial health.
Key aspects of Financial Ratio Analysis include:
Assessing Profitability
Profitability ratios, such as the Net Profit Margin and Return on Equity (ROE), are essential for understanding how well a company is generating profit relative to its revenue, assets, and shareholders’ equity. These ratios indicate the company’s ability to convert sales into profits and to provide returns to its shareholders, which are crucial for assessing the overall financial success of the business.
Evaluating Liquidity
Liquidity ratios, including the Current Ratio and Quick Ratio, measure a company’s ability to meet its short-term obligations with its most liquid assets. These ratios are vital for determining whether a business can cover its liabilities as they come due, ensuring financial stability in the short term. High liquidity ratios typically indicate a strong financial position, while low ratios may signal potential liquidity issues.
Analyzing Solvency
Solvency ratios, such as the Debt-to-Equity Ratio and Interest Coverage Ratio, provide insights into a company’s long-term financial stability by assessing its ability to meet long-term debt obligations. These ratios help evaluate the level of financial risk associated with the company’s capital structure, showing how much of the business is financed by debt compared to equity, and how easily the company can pay interest on its debt.
Measuring Efficiency
Efficiency ratios, including the Inventory Turnover Ratio and Asset Turnover Ratio, assess how effectively a company uses its assets to generate revenue. These ratios highlight areas where the company can improve its operational performance by optimizing asset use. For example, a high inventory turnover ratio might indicate efficient management of stock levels, while a low asset turnover ratio could suggest underutilized assets.
Comparing Market Value
Market value ratios, such as the Price-to-Earnings (P/E) Ratio and Market-to-Book Ratio, are used to evaluate how the market values a company’s stock relative to its earnings or book value. These ratios are crucial for investors who are assessing the attractiveness of investing in a company, as they provide insights into whether the stock is overvalued, undervalued, or fairly priced based on the company’s financial performance and market expectations.
Financial Ratio Analysis is a powerful tool that provides a comprehensive view of a company’s financial health. By regularly analyzing these ratios, businesses can monitor their performance, compare themselves against competitors, and make data-driven decisions to enhance their financial stability and growth.
What are Financial Performance Ratios Used For?
Financial performance ratios are essential tools used by various stakeholders to assess and understand the financial health and operational efficiency of a business. These ratios are derived from a company’s financial statements and provide a quantitative analysis of different aspects of the business, such as profitability, liquidity, solvency, and efficiency. The primary uses of financial performance ratios include:
- Evaluating Profitability: Investors and analysts use profitability ratios to gauge a company’s ability to generate earnings relative to its revenue, assets, and equity. This helps in determining the overall financial success of the business and its ability to provide returns to shareholders.
- Assessing Liquidity: Liquidity ratios help in evaluating a company’s ability to meet its short-term obligations. This is crucial for creditors and suppliers who want to ensure that the business can pay its bills and manage cash flow effectively.
- Measuring Solvency: Solvency ratios are used to assess the long-term financial stability of a company by analyzing its debt levels relative to equity. These ratios are particularly important for long-term investors and lenders who are concerned about the company’s ability to meet its debt obligations over time.
- Improving Operational Efficiency: Efficiency ratios provide insights into how well a company is utilizing its assets and managing its operations. Managers use these ratios to identify areas where operational performance can be enhanced, leading to better resource utilization and cost management.
- Guiding Investment Decisions: Investors rely on market value ratios to assess whether a company’s stock is overvalued or undervalued based on its earnings and other financial metrics. These ratios play a key role in guiding investment decisions and portfolio management.
Leveraging Financial Ratios for Sustained Success
There are dozens, potentially even hundreds of different ratios to track, each with a unique insight to offer. To avoid the consequences of analysis paralysis, decision-makers should focus on the financial ratios that provide the clearest, most comprehensive summaries of financial strength and business performance. Here are a few potential starting points:
Liquidity measures an organization’s ability to meet its current debt obligations. Your business may be running smoothly, and your product might be selling like hotcakes, but if you can’t keep up with your loan payments, then sooner or later your business will hit the wall. The most common financial metrics associated with liquidity are the current ratio and quick ratio. Both measure the ratio of current assets to current liabilities. In other words, if all of your debts were to come due suddenly, would you be able to pay?
The primary difference between the two measures has to do with the timeframe they address. The current ratio includes any assets that you can convert to cash within a year, whereas the quick ratio focuses on the very near term. It excludes inventory and only looks at assets that you can convert to cash within 90 days. An ideal current ratio is around two. The ideal quick ratio is one or slightly higher.
Common measures of profitability include return on equity and gross profit margin. Return on equity (ROE) assesses the efficiency at which shareholders’ equity is being used. It is an extremely important metric for CFOs and investors, who use ROE to assess the financial performance of an organization relative to its peers within the same industry.
Gross profit margin measures the margin as a percentage of total sales. In other words, it subtracts the cost of goods sold (COGS) from gross sales revenue, then divides the result by gross sales revenue. Operating margin takes a somewhat broader view of the business by including all operating expenses in the margin calculation. To determine the operating margin, divide operating income by total revenue. In this case, you subtract all operating expenses from the numerator, rather than just COGS.
Leverage ratios indicate the level of debt and debt covenant that a business has incurred relative to other accounts on the organization’s balance sheet, income statement, or cash flow statement. The most common leverage ratios are debt to equity and debt to assets. Calculate debt to equity by dividing total debt by total equity. Debt to assets, likewise, is a simple matter of dividing those two numbers to come up with the correct ratio.
Efficiency ratios indicate the productivity of working capital. In other words, how effective is the company at generating additional value from its existing assets? Common metrics include inventory turnover, asset turnover, and receivables turnover. Inventory turnover is usually calculated on the cost basis of the inventory rather than selling price. To calculate it, divide the COGS by the average inventory on hand. For consistency, you should convert the turnover rate to an annualized number. Otherwise, a comparison of monthly vs. quarterly vs. annual turnover rates would be skewed by the shorter or longer time periods over which you calculated them.
Asset turnover measures the efficiency with which a company can generate value from its assets as a whole. Calculate it by dividing total revenues by total assets. As in the case with the previous metric, you should convert the asset turnover rate to an annualized number for consistency in drawing comparisons over time.
Receivables turnover measures the effectiveness of a company in collecting money owed from credit sales. To calculate receivables turnover, divide net credit sales by average accounts receivable. Once again, make appropriate adjustments to annualize the results for comparison over multiple periods of time.
Although this is far from being a comprehensive list, it should provide a good starting point for companies that wish to align managers around a common set of KPIs. Benchmarking financial ratios across these four categories (liquidity, profitability, leverage, and efficiency) shines a light on the most important workings within a company. Monitoring specific vital signs shows companies exactly when something starts trending downward and precisely where attention and resources are most needed. In that way, financial ratios enable companies to manage their own performance closely, carefully, and comprehensively.
Using ratios for benchmarking is not a new concept. Companies have known for some time that these metrics have value; they simply lacked a good way to track them closely. Thanks to advances in financial reporting, however, tracking metrics isn’t just easier now–it’s almost effortless.
Financial Ratio Analysis Best Practices
Conducting financial ratio analysis effectively requires adherence to certain best practices to ensure accurate and meaningful insights:
- Use Consistent Data: Ensure that the data used in the analysis is consistent across all financial periods being compared. This means using standardized accounting practices and ensuring that the data is accurate and up-to-date.
- Compare with Industry Benchmarks: Financial ratios are most meaningful when compared against industry benchmarks or competitors. This provides context and helps identify how well the company is performing relative to others in the same sector.
- Focus on Trends: Rather than looking at ratios in isolation, it’s important to analyze trends over time. This helps in identifying patterns and changes in the company’s financial performance, which can indicate potential issues or improvements.
- Consider the Economic Environment: External factors, such as economic conditions, interest rates, and market dynamics, can impact financial ratios. It’s important to consider these factors when interpreting the results of your analysis.
- Use Multiple Ratios: No single ratio provides a complete picture of a company’s financial health. Use a combination of ratios across different categories (profitability, liquidity, solvency, etc.) to get a comprehensive view of the company’s performance.
Financial Performance Ratios Examples
Here are some common examples of financial performance ratios used in business analysis:
- Net Profit Margin: This ratio measures how much profit a company generates from its revenue. It is calculated by dividing net income by total revenue and is expressed as a percentage.
- Current Ratio: A liquidity ratio that measures a company’s ability to pay its short-term obligations with its current assets. It is calculated by dividing current assets by current liabilities.
- Debt-to-Equity Ratio: This solvency ratio indicates the proportion of debt financing relative to shareholders’ equity. It is calculated by dividing total debt by total equity.
- Inventory Turnover Ratio: An efficiency ratio that measures how often a company’s inventory is sold and replaced over a period. It is calculated by dividing the cost of goods sold by average inventory.
- Price-to-Earnings (P/E) Ratio: A market value ratio that compares a company’s current share price to its earnings per share (EPS). It is used by investors to assess the relative value of a company’s stock.
Managing Performance through Financial Reporting
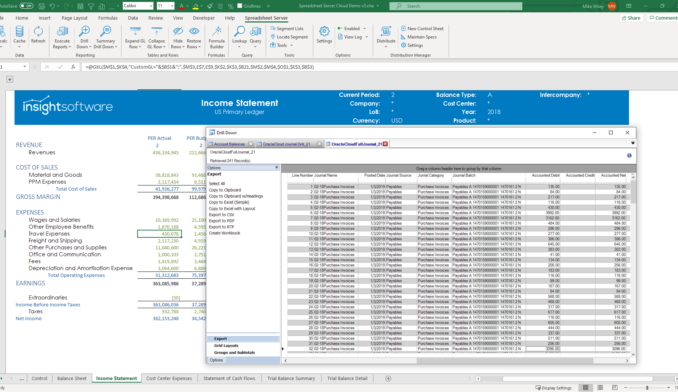
For many, financial reporting is a slow and labor-intensive process. Unfortunately, many of the most popular ERP and accounting software systems do not set out to provide these kinds of metrics out of the box. In fact, developing meaningful reports often requires a substantial commitment of IT resources, or it relies on a tedious and error-prone process of manually manipulating exported data, pasting them into spreadsheets, and adding formulas.
For companies with a purpose-built financial reporting solution, though, automation handles the hard work of collecting, integrating, and updating data. Perhaps just as importantly, a robust reporting product can query data in real time, providing information that is always accurate and up to date.
Consider the example of a report that shows the current ratio for the previous twelve months. In a traditional manual process, you might manage the report in an Excel spreadsheet using data that you key in by hand on a monthly basis. If there is ever a data entry error, the numbers will be incorrect. Likewise, if any of the numbers have changed (for example, if you make adjusting entries to a prior accounting period), then the numbers will also be wrong. The person managing this report will need to periodically review the numbers from the previous 12 months, make sure they are correct, and fix any numbers that might have changed.
Unfortunately, that scenario is all too common in many companies. It often results in numbers that are out of sync, such that the P&L, balance sheet, and KPI dashboard don’t always reflect the same results. Those kinds of inconsistencies undermine confidence in the numbers and often leave the management team arguing about which number is correct.
With automated financial reporting in place, you can avoid those kinds of issues completely. Decision-makers have access to the latest performance figures at all times, without having to retrieve them manually. With access to the very best information available, transparency increases, trust in the numbers rises, and outcomes improve. The evidence is right there in the next round of financial ratios.
Understanding the relationship between data, reporting, and enterprise performance is an extensive topic. At insightsoftware, it’s what we focus on every day. Our experts have created an extensive library of resources to help business leaders explore these topics at length. One such resource is our Financial Ratios Dashboard. It’s free to download and use, and it can help you better understand where your organization is today with respect to some of the key metrics that can provide greater focus and direction for your business.
The Financial Ratios Dashboard can help you learn more about which ratios are most meaningful for your business and how to calculate them. When you download the dashboard, you’ll also learn how dynamic dashboards can bring financial ratios to life, helping you to align key leaders throughout your organization around the KPIs that matter most.
We encourage you to read through the dashboard to learn more about the financial ratios you need to track and how to adapt your financial reporting accordingly. Get our Financial Ratios dashboard template and customize it with your own data today.

Related Resources