Viewpoint
Financial Reporting, Budgeting, BI, & Analytics Solutions for Trimble Viewpoint
See for yourself why 500K+ are using insightsoftware to draw instant data insights, react swiftly to market changes, and outpace their competition


Seamless integration with Viewpoint Vista or Spectrum

Excel-based Reporting for Viewpoint, Yardi, Sage & More
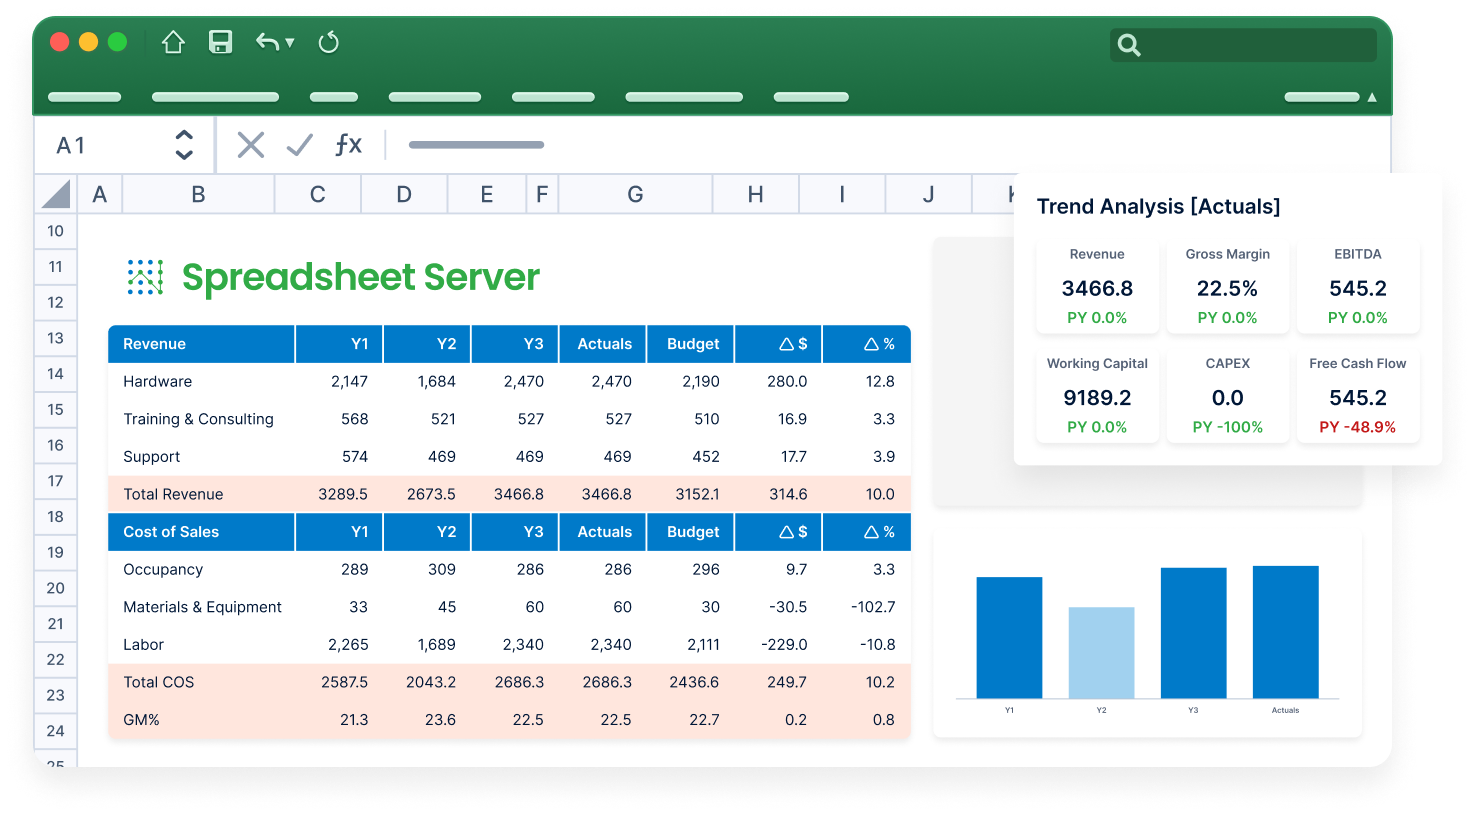
Spreadsheet Server is easy to install and delivers fast time to value. It automates custom reports with drill-down to transactional data.
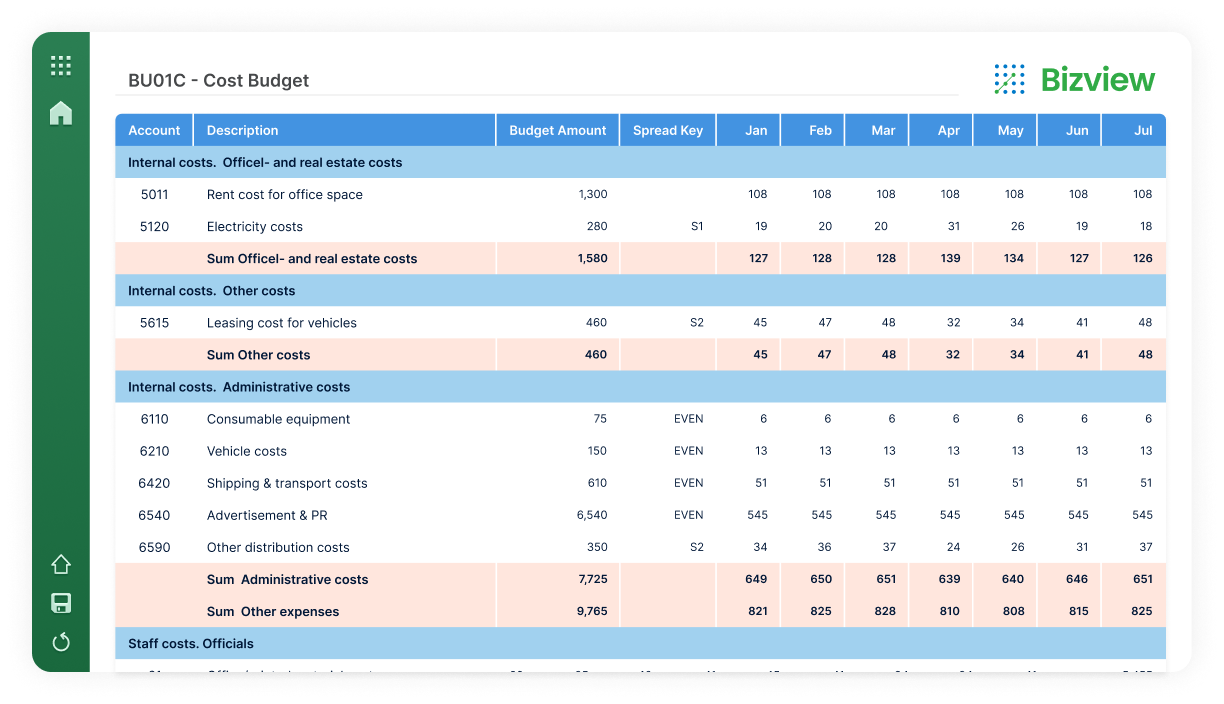
Budgeting & Planning
Budgeting & Planning: Bizview is an integrated and scalable web-based budgeting, planning, and forecasting solution.
Flexible, Easy-to-Use Reporting and Analysis Tools for Viewpoint Vista or Spectrum

Analysis of Financial Data is Slow and Laborious
The lack of a flexible drill-down capability from financial reports into live transactional data slows down key financial processes, such as investigating an issue with a trial balance, validating adjustment entries, or reconciling discrepancies in account balances.

Manual Report Processes are Consuming Too Many Resources
Manually exporting data from Viewpoint Vista or Spectrum into Excel for reporting and analysis against financial and job cost data is inefficient and prone to errors, reducing the time that valuable resources have available to conduct other high-value activities.

Non-Technical Users Depend on IT for Data Access
Viewpoint is built to collect data, not necessarily to report on data. When your business users don’t have the technical skills to get the reporting they need, you have to rely on expensive technical experts or IT to create custom reports or make any modifications.
Create Reports and Analyze Viewpoint Vista or Spectrum Data Without Requiring Technical Knowledge
Create Live, Drillable Financial Reports Inside Excel
Work in an environment you’re already familiar with—: Microsoft Excel. Pull real-time balances for income statements, balance sheets, and cash flows. Create ad- hoc inquiries against GL, Job Cost, and any other Viewpoint module without relying on IT or needing technical knowledge. Choose from a library of pre-built content to get started or create a custom report in minutes.
Get Instant Demo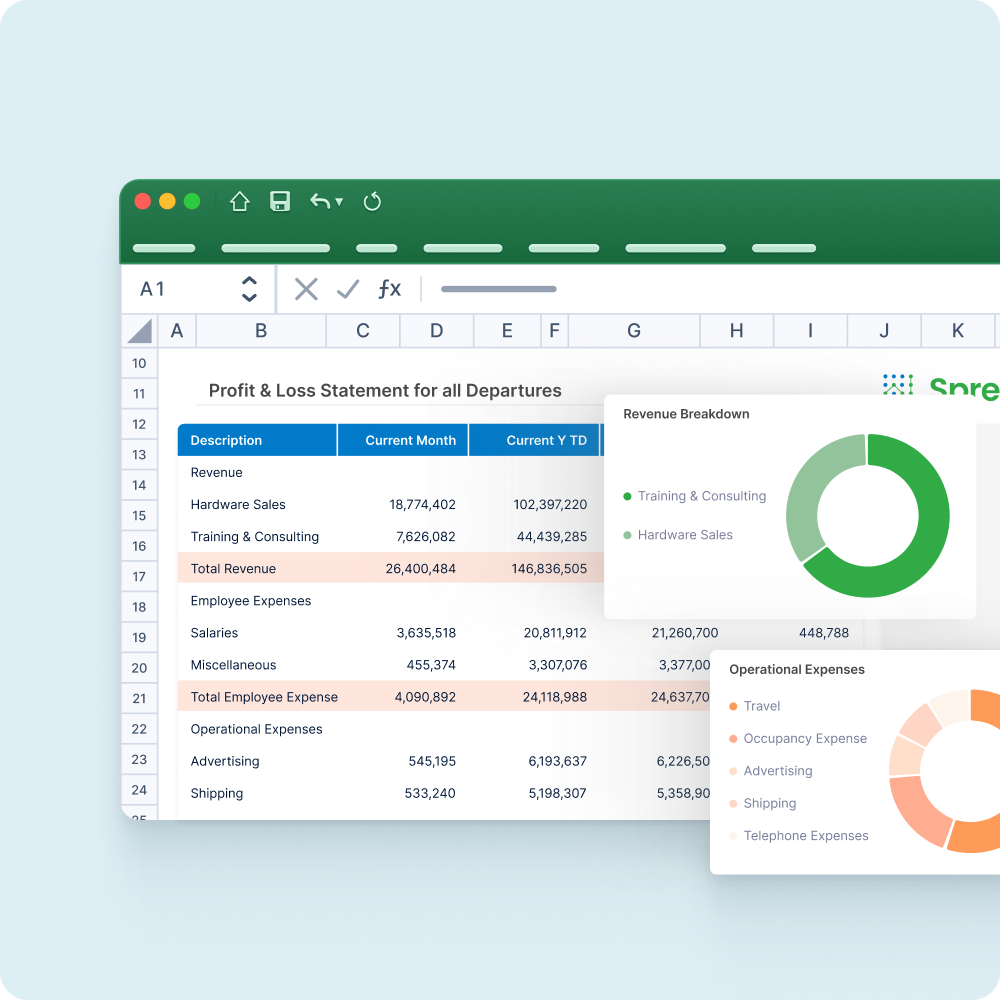
Investigate Reconciliation and Integrity Issues, Fast
Drill down to view balances based on your GL account structure. Breakdown by your account segments (e.g., company, natural account, cost center, and position). Then drill down through journal entries and into sub-ledger transactions (e.g., to see AR and AP details) to quickly find and fix account reconciliation and data integrity issues.
Get Instant Demo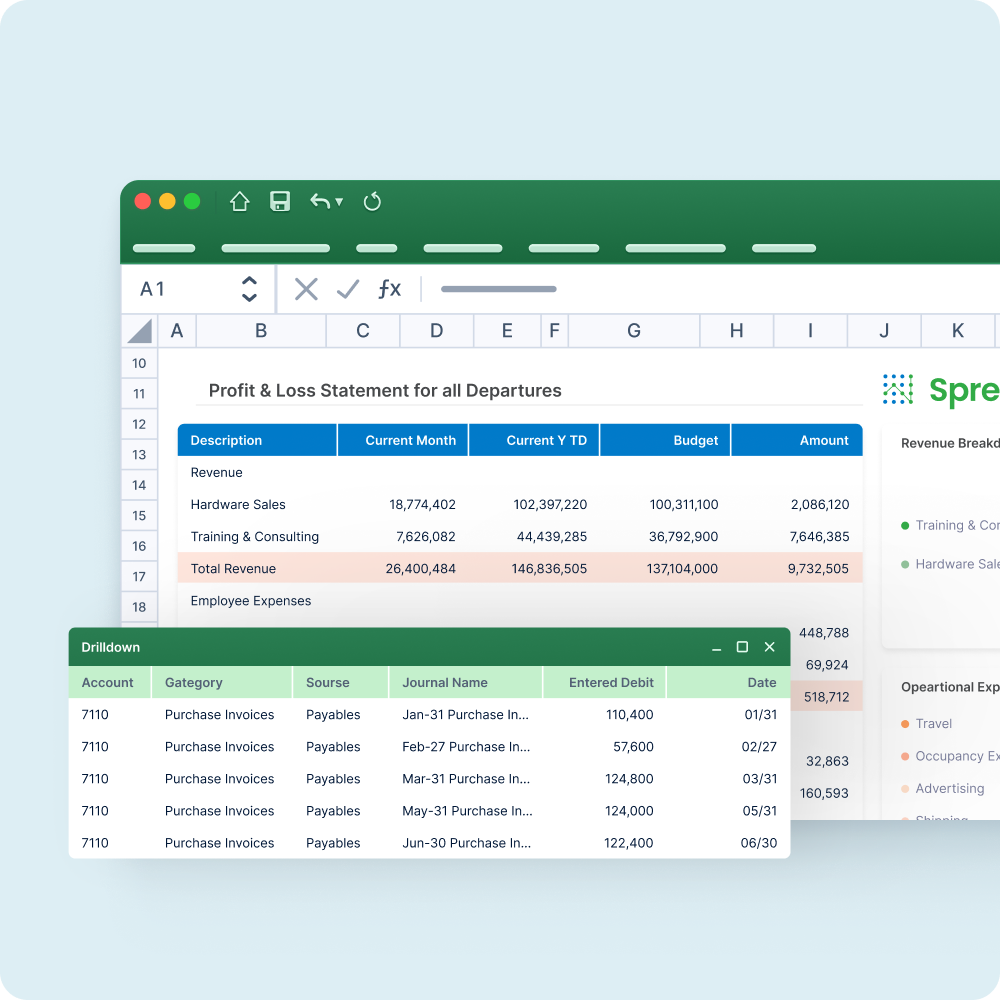
Take Control of Your Costs
Use custom AP and AR aging reports to help stay on top of cash flow. View Job Cost reports to see a breakdown of costs and hours by client, project, job manager, etc., so you can track and measure performance. Mix and match data from any Viewpoint table and combine with information from other systems within one report.
Get Instant Demo
Easy Financial Reporting for Viewpoint
See how Spreadsheet Server can help your organization save time and get a clearer view of your business data with:
- Real-time access to Viewpoint data within Excel
- Drill-down capability from summary to transaction
- The ability to create custom queries from any relational database
- A wide range of reports for your organizational needs
