How to Connect Power BI to a SQL Server Analysis Services Database
SQL Server Analysis Services is a powerful tool that plays a critical role in enabling organizations to perform complex data analysis and business intelligence tasks. By leveraging the capabilities of SSAS, businesses can transform raw data into actionable insights, driving informed decision-making across the enterprise.
What is SQL Server Analysis Services?
SQL Server Analysis Services (SSAS) is a component of Microsoft SQL Server that provides tools for data analysis and business intelligence. SSAS allows organizations to build sophisticated data models that support fast, complex querying and reporting. It enables users to create multidimensional cubes or tabular models, depending on the specific needs of the business. These models are designed to handle large datasets and provide high-performance analytics, making it easier for users to explore and analyze data in a way that supports strategic decision-making.
What is a SQL Server Analysis Services OLAP Database?
A SQL Server Analysis Services OLAP database is a specific type of database within SSAS that is built to support Online Analytical Processing (OLAP). OLAP databases in SSAS are organized into multidimensional structures known as cubes, which allow for the rapid execution of complex queries across large volumes of data. These cubes are composed of dimensions and measures that enable users to perform deep, multi-faceted analysis, such as slicing and dicing data across various axes (e.g., time, geography, product lines). An OLAP database is particularly useful in scenarios where quick access to summarized data is crucial, such as financial reporting, sales analysis, and forecasting. By storing data in a way that optimizes performance and flexibility, a SQL Server Analysis Services OLAP database empowers organizations to extract meaningful insights and make data-driven decisions efficiently.
In this tutorial, you will learn how Power BI connects to a SQL Server Analysis Services OLAP database and how to get data from there. SQL Server Analysis Services databases are one of the most common data sources for Power BI.
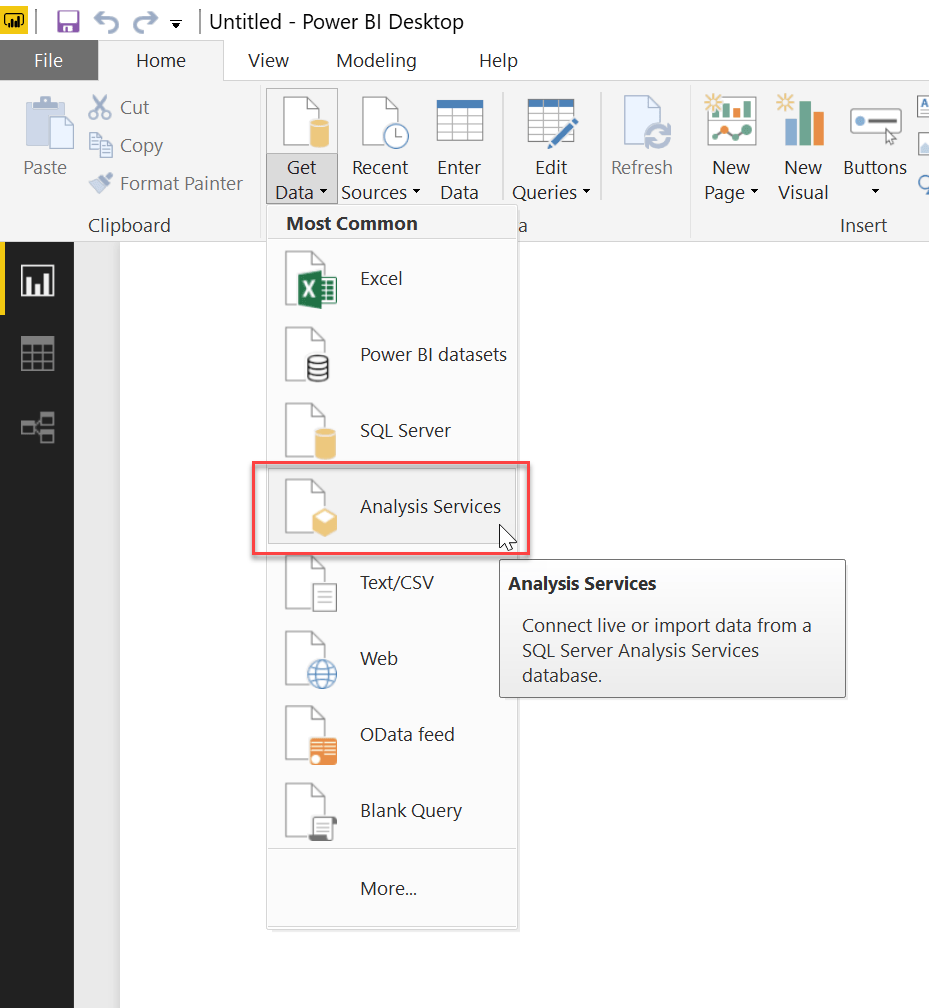
The first step is to go to Get Data >> Analysis Services:
This opens the Analysis Services connector:
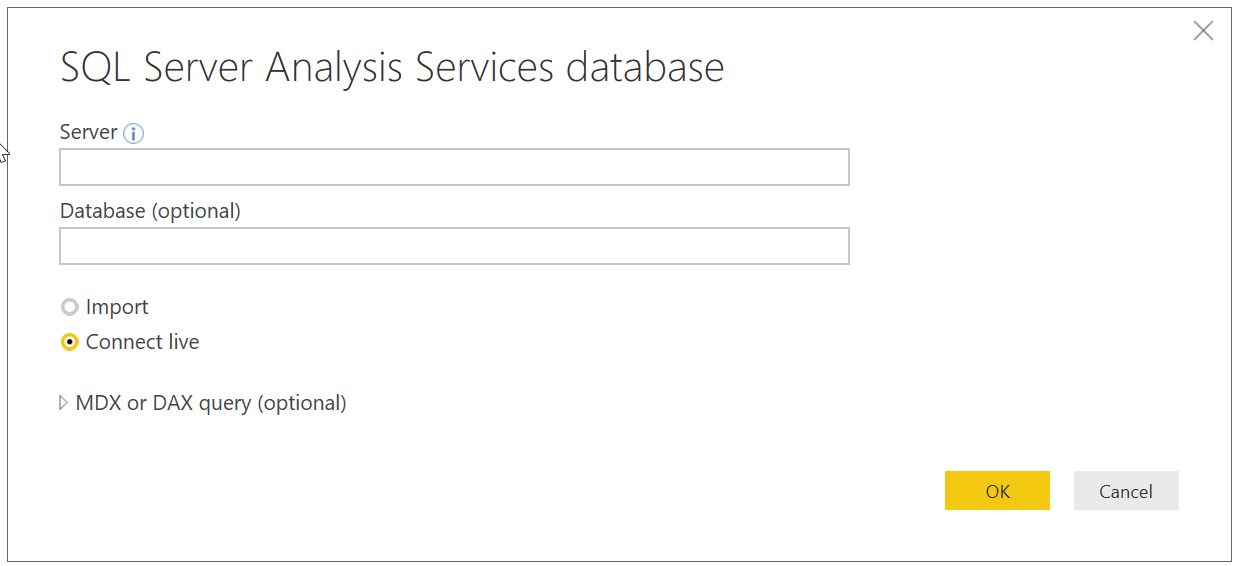
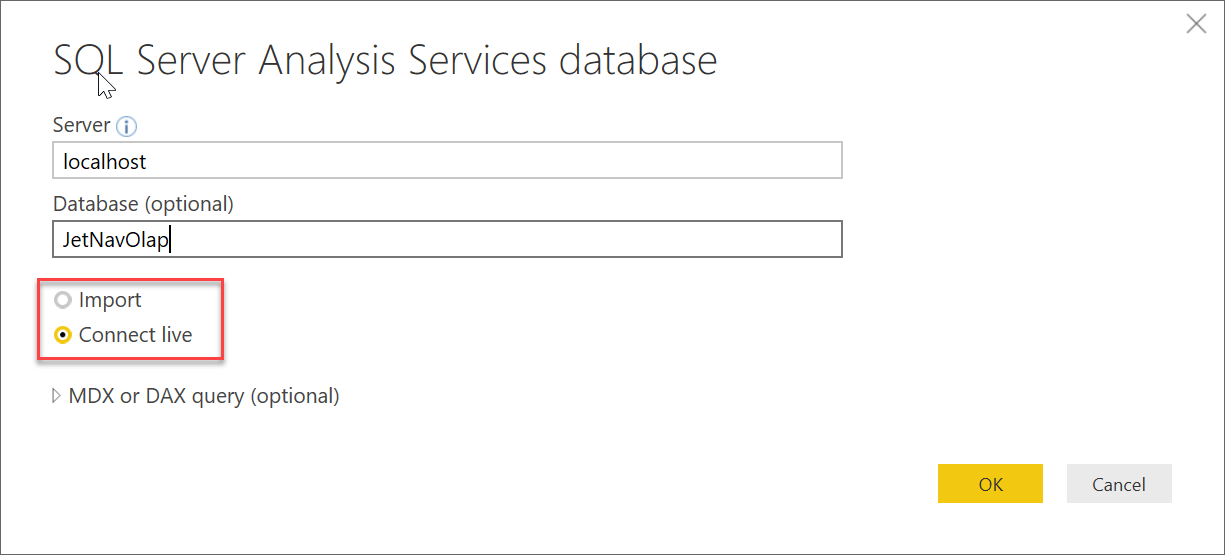
Enter the SQL Server name and the database name as required:

Next, you have two options to choose from:
- Import – Loads data from database into Power BI Desktop
- Connect Live – Data stays in the database and the query is executed each time you interact with visuals
For this example, we will use the Connect Live option.
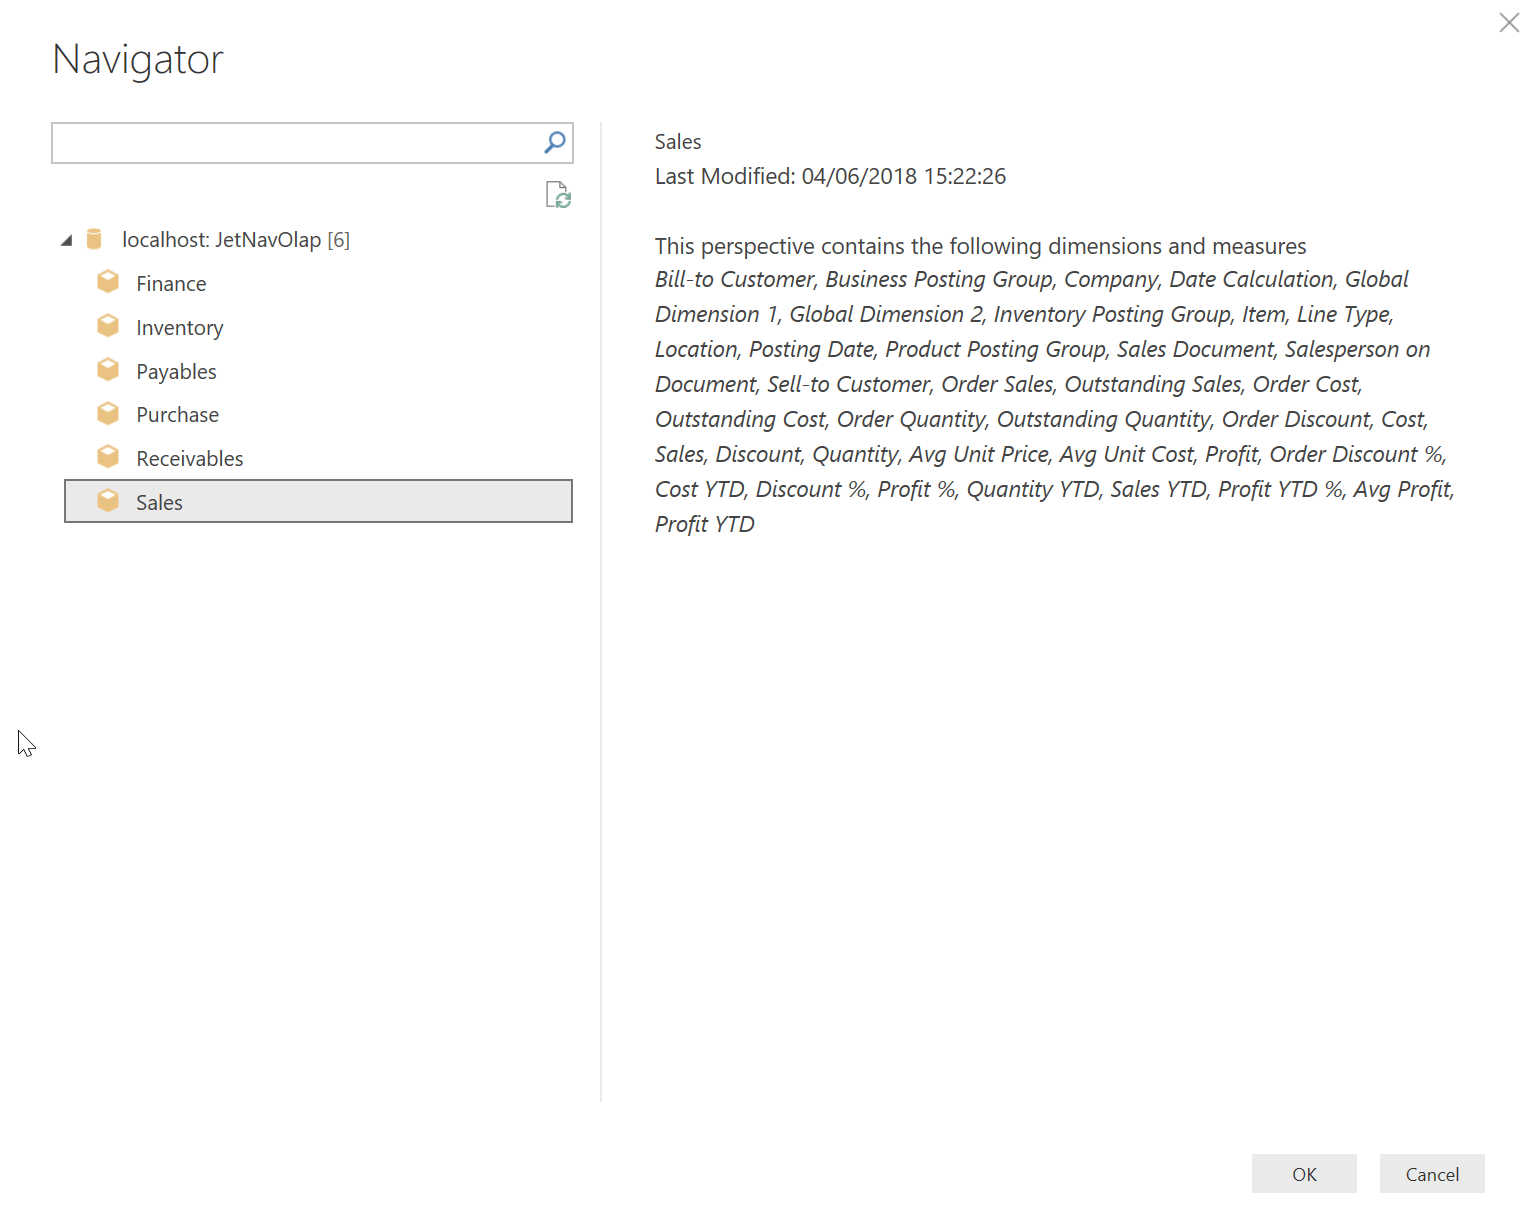
Although it is possible to write in an MDX or DAX query, this isn’t very common. Just click OK and the connection will be established. The Navigator window will show the cubes that are in the database. If you select a cube it will show the dimensions and measures that exist in the cube. Select the Sales cube and click OK.
At this point, you are ready to start creating visualizations.
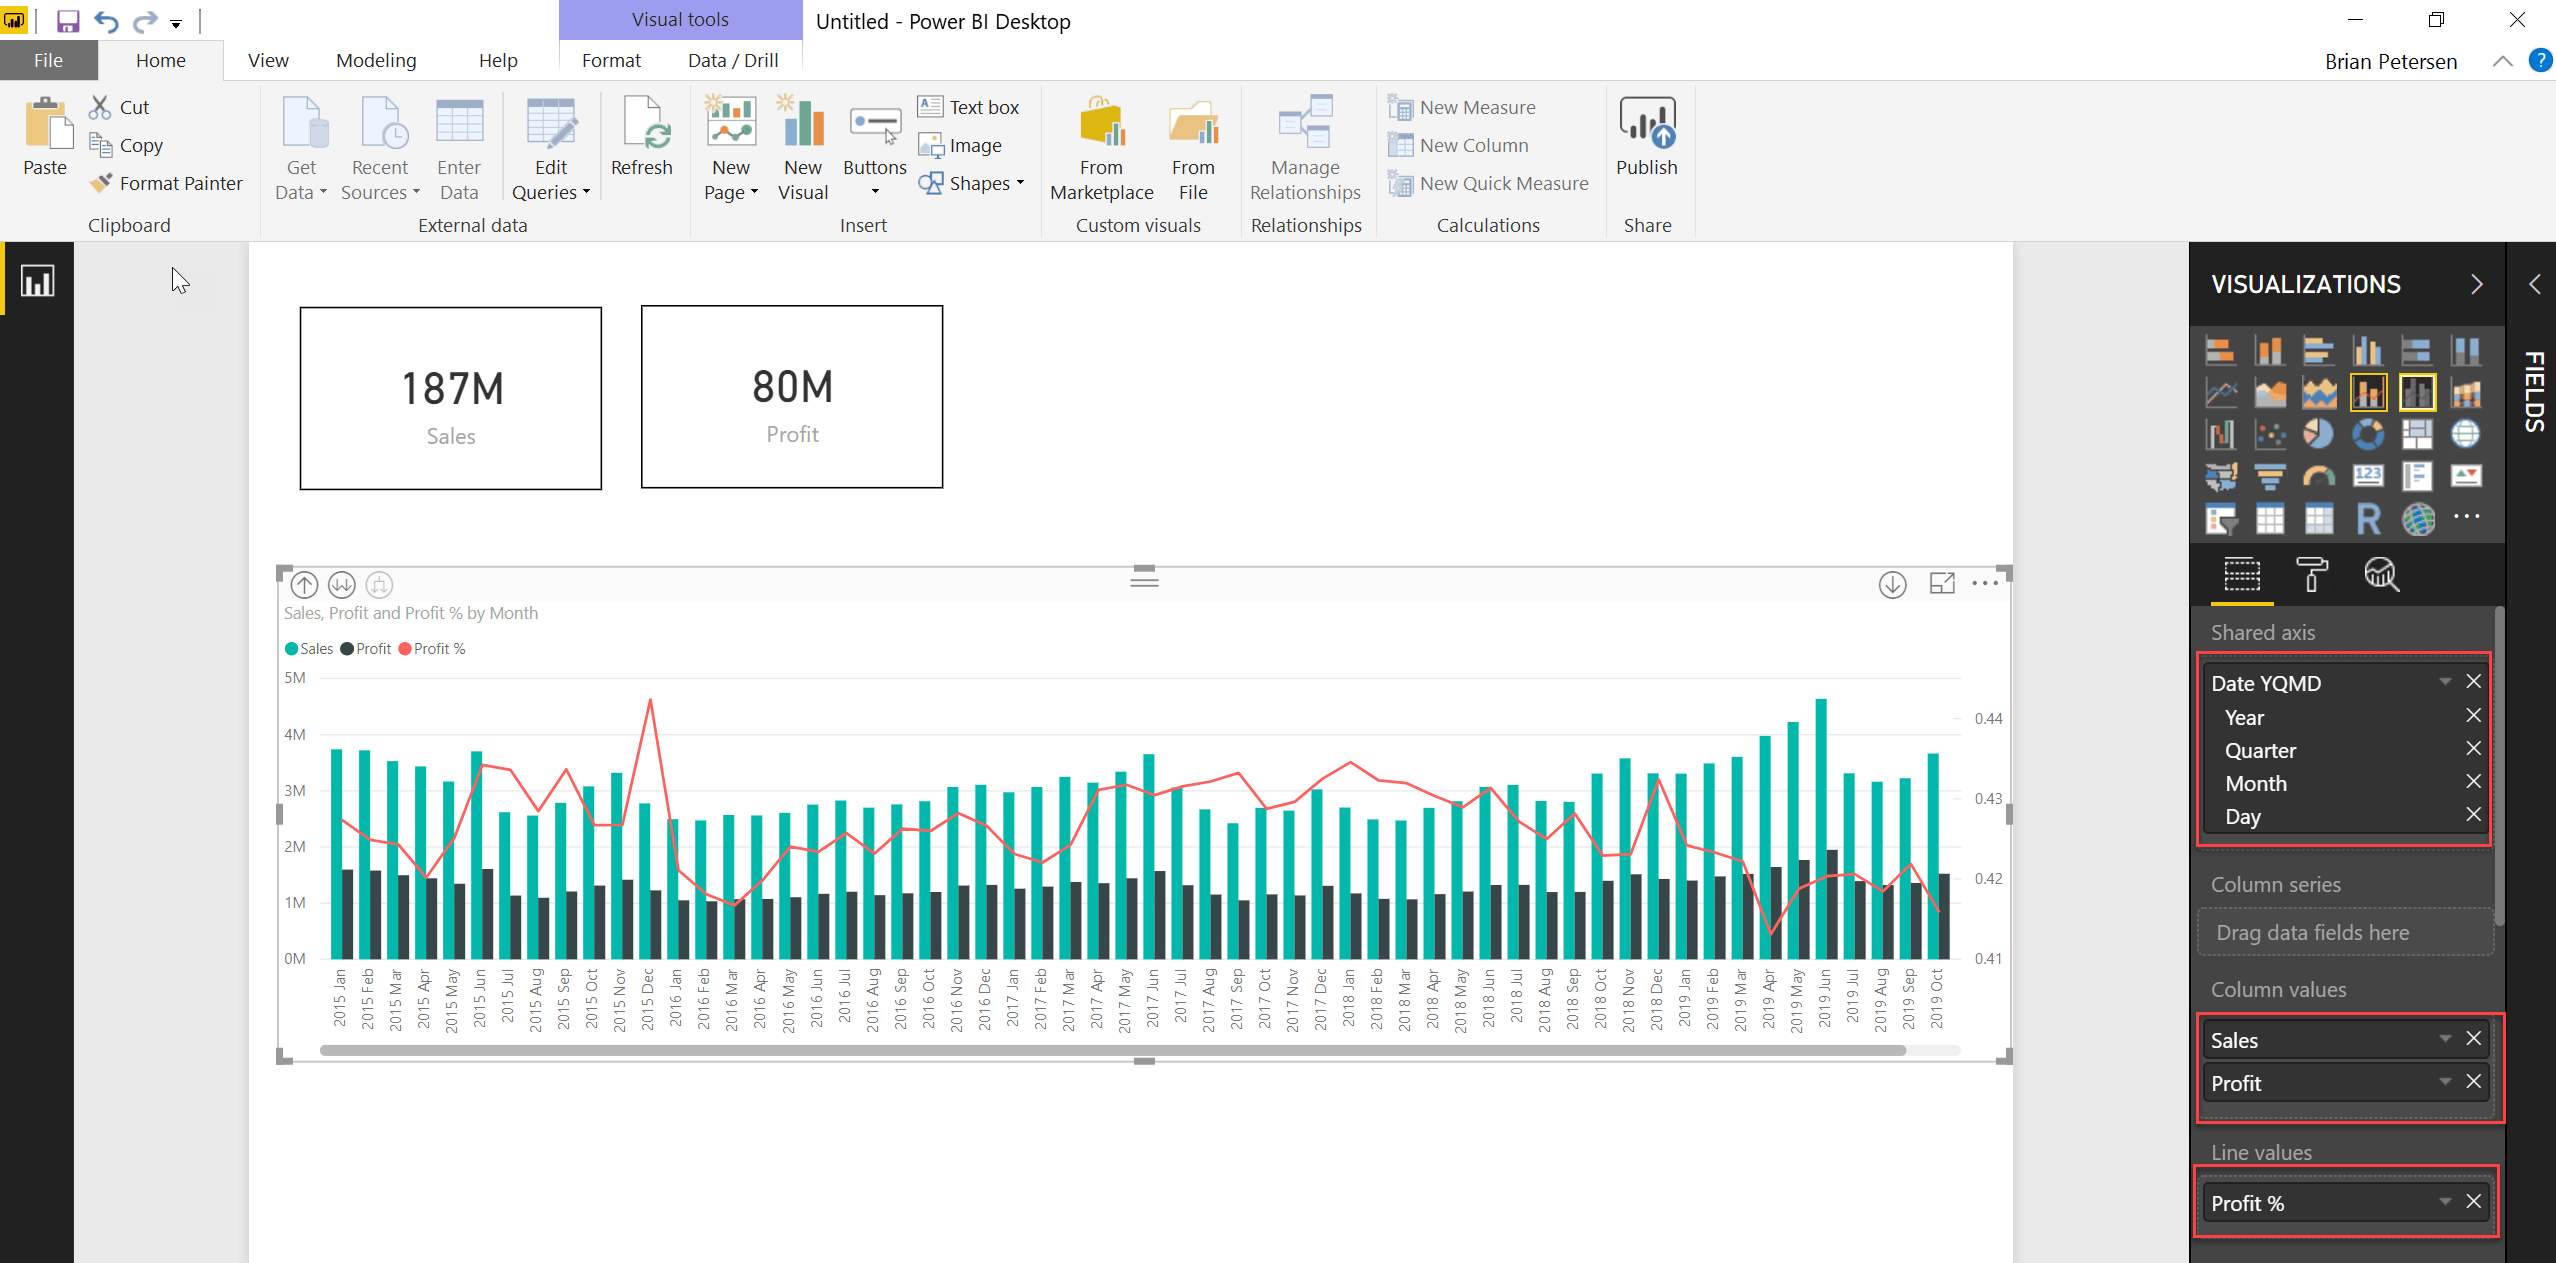
Ex. Drag Sales and Profit out onto the canvas and format them to use the Card Visual:

Step 4: Create a Line and Clustered Column Chart with Sales, Profit, and Profit %
Next, drag out Sales, Profit, and Profit % as a “Line and clustered column chart” across months using the date hierarchy in the Posting Date dimension. Dragging Profit % into the Line Values section will plot it on a separate axis.
Then drag the Company dimension out and format it as a Slicer visual with a horizontal orientation to make it easy for users to filter data by each company.
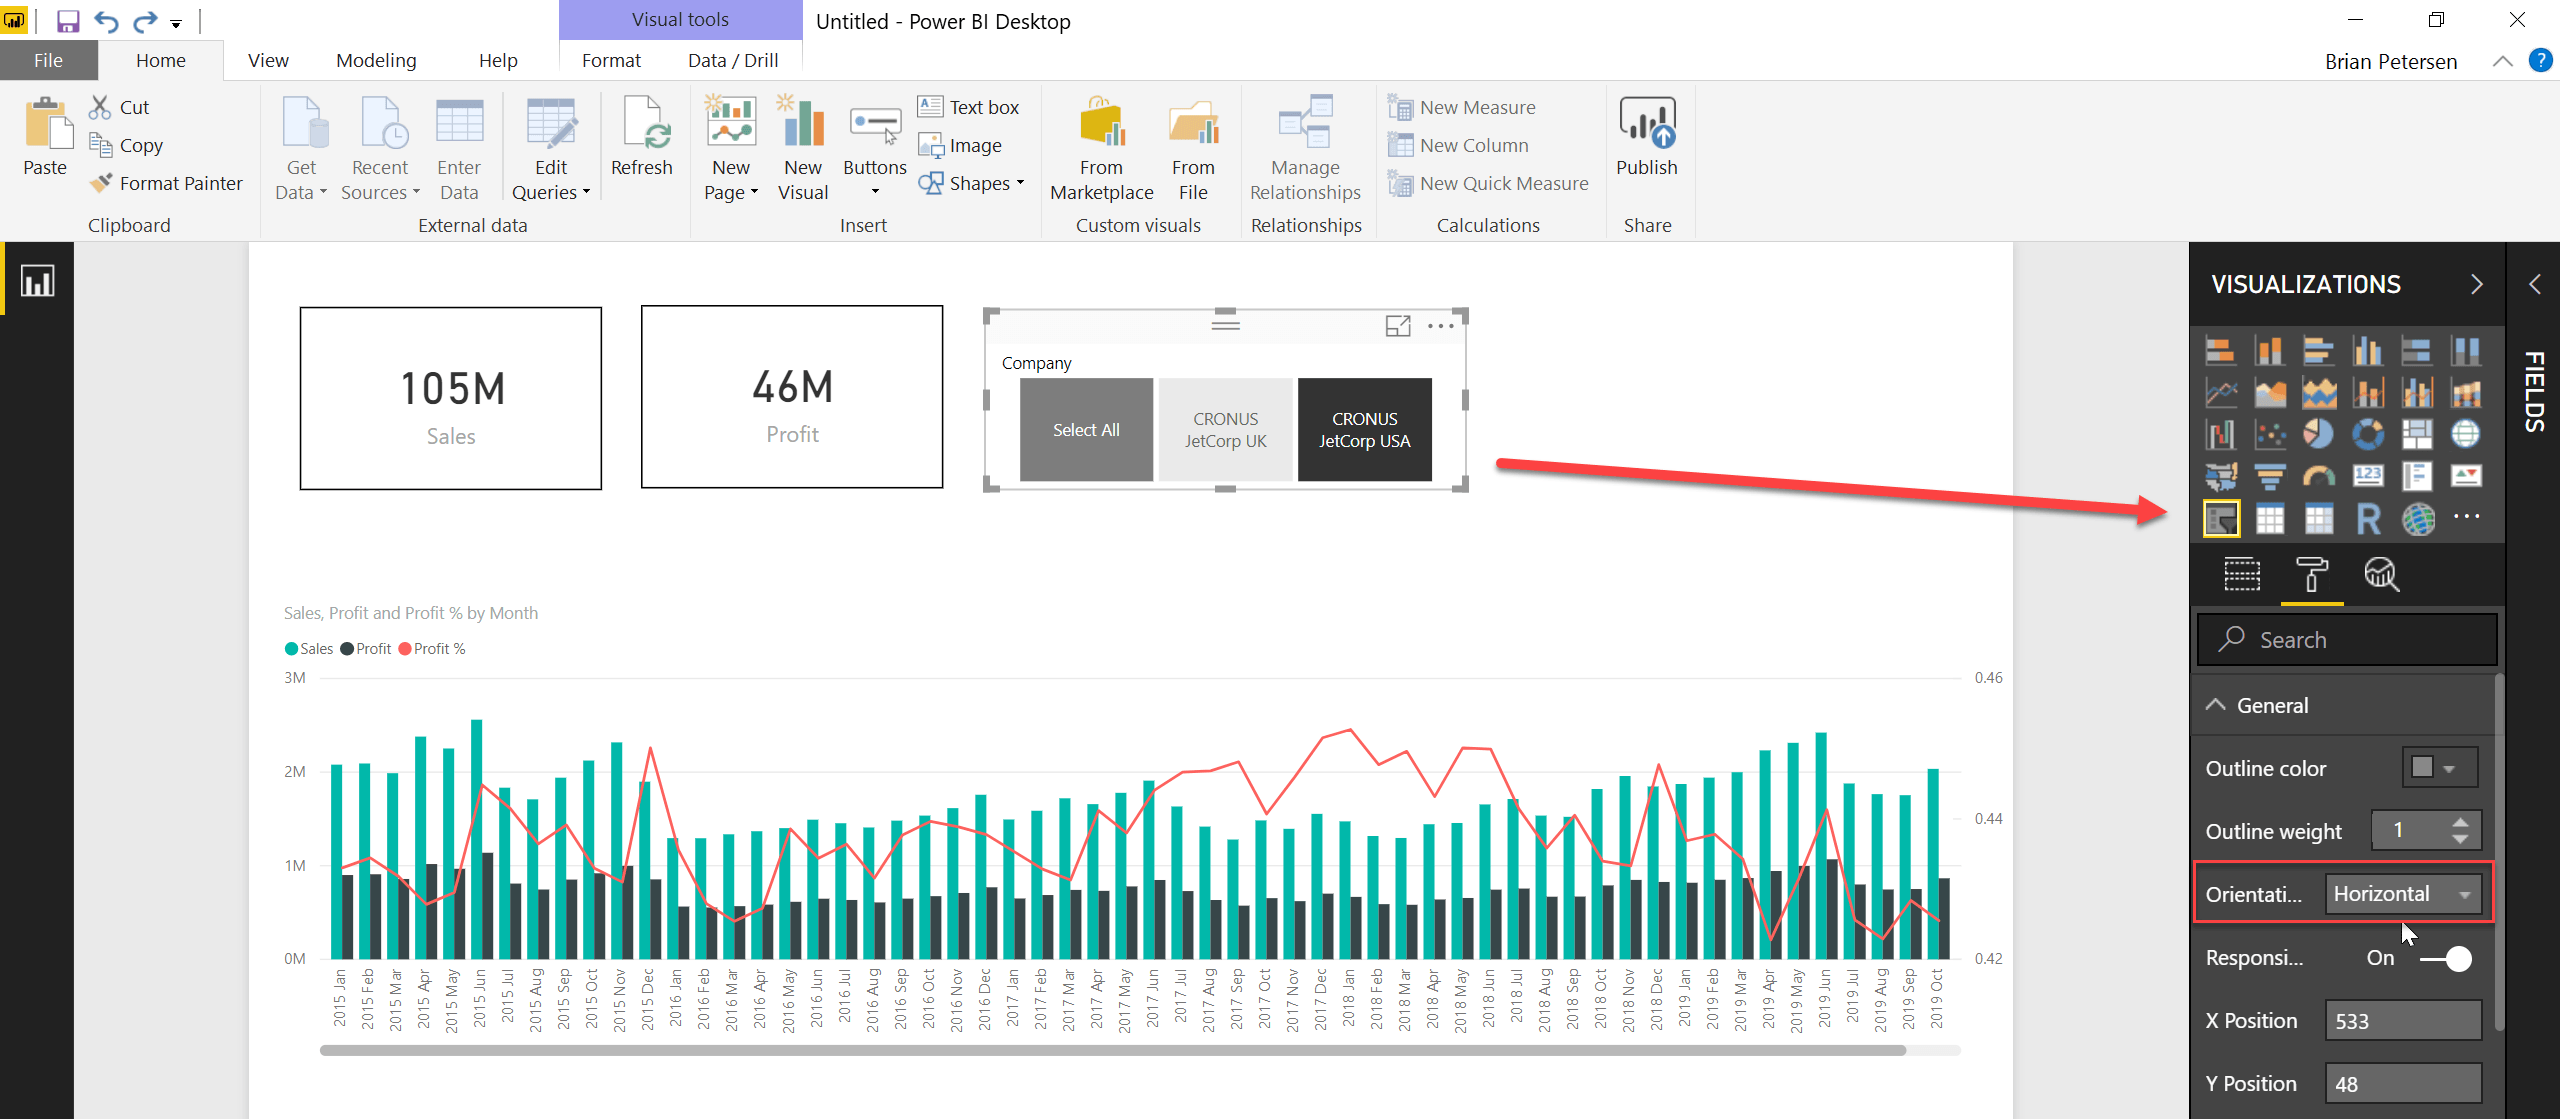
Finally, click the Image button in the Insert section of the ribbon and select a file with your corporate logo to personalize the dashboard with your company branding.
![]()
We love working with Power BI and we love showing you how to do more with it. Learn more about how Jet Reports works with Power BI.
Learn also how to configure and connect the Simba Spark JDBC Driver with SQLLine.