How to Link Analytics from Multiple Data Sources in Your Application
Interacting with billions of rows of data in seconds from a single source is exciting. But what happens when you need to work with data across multiple sources?
You might have product reviews indexed in Elasticsearch that you’d like to correlate with product purchase history in an enterprise data warehouse. Or maybe you have consumer behavior data in Hadoop, but you’d like to enrich that data with some demographic information stored in an Oracle database and partner information stored in a cloud data warehouse.
All of this requires an agile and flexible approach to multisource analytics to get the richer, more informative content and insights.
In this post, I’m going to show how Logi Composer allows you to link to multiple data sources all within the same dashboard.
In this dashboard built with Logi Composer, our end user Brian Williams has three visualizations embedded inside the Wine Cellar application.
The data for these three visualizations comes from two different data sources: The bar chart on the left and the tree chart on the right use a flat file data source while the pack bubble chart on the left uses Apache Solr, a search engine data source.
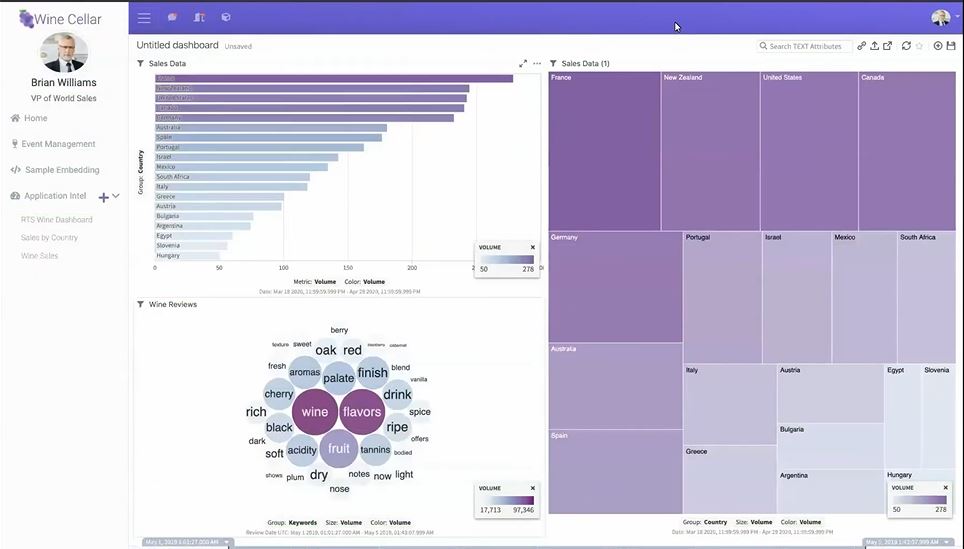
Using the tree map on the right, Brian wants to analyze wine sales in France by filtering down the data in the entire dashboard, including visuals using different data sources such as the bubble chart showing wine varieties.
With Logi Composer, Brian can easily establish a cross-source relationship between different data sources with a few simple clicks.
Using cross-source linking directly from the UI, Brian can establish a logic relationship between multiple sources on a given field. For example, by creating a link between the two sources on the “country” field, Brian can now apply a filter to a single visualization and filter down the entire dashboard, including a visualization using completely different data sources, and see wine sales data for France.
Cross-source linking is another way Logi Composer’s self-service goes beyond simple data discovery to a more sophisticated application experience.
Ready to try it yourself? Download a free trial of Logi Composer today.