Top Five Financial KPIs for Utilities Industry

Key performance indicators have never been more important for those in the utilities industry. Why? Because this sector is undergoing transformational changes.
The push for sustainable energy means that new energy sources and delivery methods are coming online and will for years to come. Utility companies will need to report and monitor their KPIs obsessively to understand how these new approaches to energy are positively and negatively affecting their financial performance metrics.
COVID-19 introduces another level of uncertainty. The global pandemic has had a drastic impact on energy supply, which has fallen precipitously, and demand, which is down overall but spiking in residential areas. Regardless of whether these unprecedented circumstances have helped or hurt a utility company, a company can’t understand the full effect without closely tracking KPIs. Anything less would be pure speculation.
Utility companies also face increased competition, new regulations, changing technical requirements, rising costs, and other factors that complicate financial performance. Assumptions won’t work in this energy economy. Instead, companies need to rely on their KPIs to highlight what’s actually happening, then make plans and provisions based on the best data available.

Decision-makers need to focus on the key performance indicators, the most urgent and insightful, or else they risk getting overwhelmed with irrelevant data resulting in analysis paralysis. This is no time for delays, so focus on these five KPIs above all others.
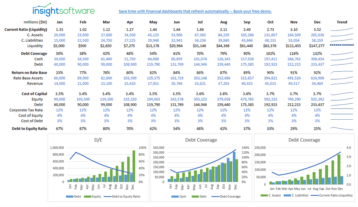
1) Liquidity
How much unrestricted cash is on hand based on the company’s current assets compared with its current liabilities? Liquidity takes on new importance in the current climate, in which sweeping and unexpected shifts can throw cash flow into turmoil. Therefore, decision-makers need to track this metric constantly (ideally in real time) rather than getting weekly, daily, or even hourly updates.
2) Debt Service Coverage
How much cash is available to cover current debt obligations? Lenders use this metric to inform financing decisions, which many utilities will need in the coming years to cover new construction costs. If debt service coverage falls below a certain threshold (different for every lender), financing offers will dry up, so it’s important to watch this metric closely and constantly.
3) Return on Rate Base
How much does the rate base (the assets that determine utility rates) return on investment? This metric informs a utility’s revenue requirements and can shift up or down based on how a utility manages powerplants, pipelines, and other core assets. Said another way, this metric is at the heart of financial performance and requires close observation.
4) Cost of Capital
How much does capital from all sources (debt and equity) cost by weighted average? As utilities prepare to make major new investments, the cost of capital will help decision-makers select the most fiscally viable options available. Like all the metrics presented here, this one factors into most financial (and operational) decisions facing a utility. Owing to that importance, decision-makers need to know the cost of capital in multiple contexts at all times.
5) Debt-to-Equity Ratio
How much debt compared with equity does the company rely on to finance operations? Compared with other industries, utilities often have a high debt-to-equity ratio because of hefty infrastructure costs, which subjects them to interest rate risk if this metric isn’t monitored effectively. It should be, considering that all industries consider the debt-to-equity ratio to be a fundamental indicator of financial performance. Download our free Debt-to-Equity Ratio sample dashboard template.
Hopefully, the list above contains few if any surprises. Most utility companies track these metrics in some form already, often as part of a monthly or quarterly financial reporting process. But that doesn’t mean utility companies track them effectively, efficiently, or insightfully.
Any company that plans to use data to help it navigate the present moment and whatever comes next needs to scrutinize what it tracks in terms of KPIs and how it gets the information it needs. When tracking KPIs takes too much time, manual input, or technical expertise, KPIs lose much (or all) of their value. The information may be too old, incomplete, or unreliable to benefit anyone. Worse, decisions based on bad information could have disastrous consequences in these sensitive times.
Knowing the stakes, many CFOs, particularly those leading utility companies, are looking for new ways of utilizing KPIs, financial data, and efficient reporting processes. These forward-thinking executives realize they will sink or swim based on the quality and quantity of data at hand. If you’re also wondering how to get the information you need to make the tough decisions ahead, insightsoftware is here to help.