How to Build a Free Cash Flow Dashboard, with Downloadable Template

Hundreds of different performance indicators exist, but fewer than 20 are considered absolutely essential. They have that designation because companies have discovered a direct correlation between the trajectory of these metrics and their own success or failure. To put it plainly, companies can’t understand how well they’re actually doing without tracking key performance indicators.
Free cash flow is one of the most important. Like all true KPIs, free cash flow doesn’t obfuscate the issues. Quite the opposite, in fact. The free cash flow metric focuses on one crucial aspect of finance that has an outsized impact on a company’s strategic agenda. Therefore, companies must track this metric carefully and frequently.
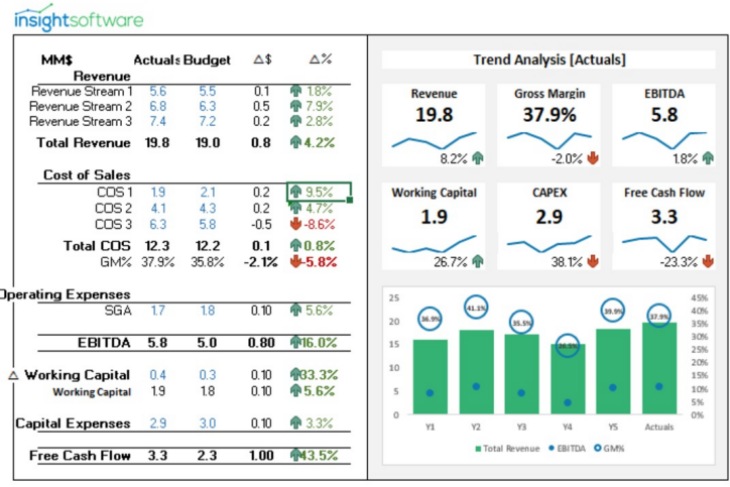
Our team at insightsoftware has created a free downloadable template illustrating what a best-in-class dashboard looks like. Spend some time exploring the dashboard to discover how easy it is to track free cash flow and how much decision making improves as a result. Before you dive in, however, learn more about the free cash flow metric, where it comes from, and what it means for forward-thinking leaders.
What is Free Cash Flow?
Cash flow is the lifeblood of a business, but it’s a mistake to look at this metric in blanket terms. Free cash flow measures the amount of cash on hand after removing capital expenditures. Said differently, this metric measures how much cash is actually on hand, meaning how much companies could access immediately if necessary.
How Do You Calculate Free Cash Flow?
Calculate free cash flow by subtracting capital expenditures from the cash flow from operations. Traditionally, metrics come from the cash flow statement, which makes the information easy to find, but also creates the risk of outdated insights. In practice, the hard part isn’t calculating free cash flow; it’s updating the underlying data so that the metrics reflect the current conditions.
What Does Free Cash Flow Indicate?
Companies with abundant free cash flow have money on hand to expand operations, invest in R&D, reduce debt, buy stock, or pay dividends. Essentially, they have money to use strategically. Plus, since free cash flow is driven by operating revenues, when this metric is high it suggests that companies are selling successfully. On the other end of the spectrum, inconsistent or insufficient free cash flow leaves companies with few options for addressing problems or building growth.
Where Do Dashboards Fit In?
When the CFO and other decision makers aren’t updated about free cash flow on a daily basis, it leaves them with a huge blind spot in terms of enterprise performance. Unfortunately, manually tracking the underlying data is cumbersome at best and impossible at worst. This is why many companies update this metric occasionally instead of constantly.
Dashboards enable you to refresh data as often as you need. They automatically integrate and analyze enterprise performance data, then deliver real-time updates right to your screen. That way, the free cash flow metric is always accurate and constantly up to date, providing the most current information at a glance.
To fully appreciate what dashboards can do, you need to interact with one hands-on. They’re more accessible than people expect, and more instructive too. Far from being mere data trackers, they’re actually sophisticated decision-making tools that have a remarkable ability to highlight important insights. Discover the power of dashboards for yourself by exploring this downloadable free cash flow dashboard.