Calculated Columns vs Measures

The choice between using a calculated column or a measure depends on the specific requirements of the data analysis task at hand.
- Use Calculated Columns when:
- You need to perform row-level calculations that are static and do not change with the context of the data.
- The calculated value needs to be stored in the model, for example, when creating a new categorization or segmentation that will be used consistently across multiple reports.
- Use Measures when:
- You require dynamic calculations that adjust based on the user’s interaction with the data, such as filters or slicers.
- You are performing aggregations or calculations that need to consider the entire data set or significant portions of it, and these calculations may change with the analysis context.
What are Calculated Columns
Calculated columns is a feature found in data modeling and business intelligence tools that allow users to add new data columns to their tables based on calculations or transformations of existing data. These calculations can be simple mathematical operations, concatenations of text, or more complex expressions involving conditional logic and functions. Calculated columns are computed during the data refresh process and are stored within the model, making their values static with respect to each row in the table. This means once the calculation is performed and the data is loaded into the model, the values of a calculated column for each row remain constant until the next data refresh. Power Bi Weeks uses calculated columns in data modeling.
Key aspects of calculated columns include:
-
Static Nature
- Once calculated during data load or refresh, their values do not change until the next refresh.
-
Row-level Context
- Calculated columns operate at the row level, computing their values based on other values in the same row.
-
Storage Impact
- Since calculated column values are stored in the data model, they increase the size of the model based on the data type and length of the calculated column.
-
Versatility in Use
- They can be used in direct queries, filters, and as part of visualizations without requiring additional calculation at query time.
What are Measures
Measures, on the other hand, are calculations used in data analysis and business intelligence that are computed at query time, based on the current context provided by filters, slicers, and other elements of the report or data visualization. Measures are dynamic and can aggregate data across many rows, unlike calculated columns which are computed row by row. Common examples of measures include sums, averages, counts, minimums, and maximums. Measures are defined using a formula or expression and are recalculated whenever the data context changes, making them highly flexible and powerful for interactive analysis.
Key aspects of measures include:
-
Dynamic Calculation
- Measures are calculated on the fly, adjusting their values based on the current context or filters applied to the data.
-
Aggregate Nature
- They often aggregate data over a set of rows, which makes them ideal for summaries, totals, and other calculations that need to consider many rows at once.
-
No Direct Storage Impact
- Measures do not store their results within the data model; instead, their values are computed at query time, which means they have a minimal impact on the size of the data model.
-
Context Awareness
- The value of a measure can change based on the context in which it is used, such as different filters or dimensions applied to the data.
Calculated Columns vs Measures Examples
When you start using Power BI, you will realize that often, there is more than one way to accomplish the same goal. For example, when you perform an analysis of your data in Power BI, you will likely need to enrich your data model with calculations, many of which could be done by using calculated columns, measures, or both. In this article we are going to review the difference between calculated columns and measures and discuss use cases for each.
Sample Data Model
To draw the distinction between calculated columns and measures, we are going to use the following simplistic data model:
| Product | Revenue | Cost |
| A Pro | $250 | $180 |
| B Comp | $600 | $200 |
| A Comp | $900 | $810 |
For the purposes of our examples, we are interested in computing two metrics:
- Total margin in dollars
- Margin as a percentage of revenue
Before we get into writing formulas, we are going to review what calculated columns and measures are. Both calculated columns and measures are created using DAX (Data Analysis Expressions).

How to Build Useful KPI Dashboards
Download Now:
Calculated columns
A calculated column is an extension of a table using a DAX formula that is evaluated for each row. These columns are distinguished from columns that you obtain from your data source or using Power Query Editor because calculated columns are computed based on data that has already been loaded into your data model.
If you are accustomed to using Excel, you will remember that in Excel you often need to copy a formula for each cell of a new column, unless you format your range as a table. This results in each cell potentially having a different formula because of different cell references. When you write a calculated column formula, it is automatically applied to the whole table and evaluated individually for each row.
The values in calculated columns are evaluated when you first define them or when you refresh your dataset. Once evaluated, the values are stored in your data model, which means your data model size increases and it consumes more RAM.
To create a calculated column, you need to do the following:
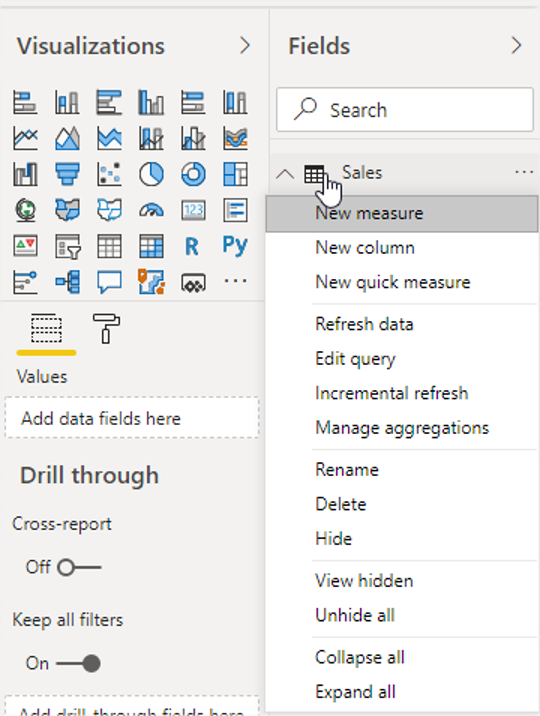
- In the Fields pane, select the table you want to create a calculated column in. It is important to select the right table because if you choose wrong, you will have to delete and recreate the column in the right table.
- Click Modeling, Calculations, New Column.

Alternatively, you can right-click on the table and select New column:
The formula bar will then appear, and you will need to specify your calculated column formula:
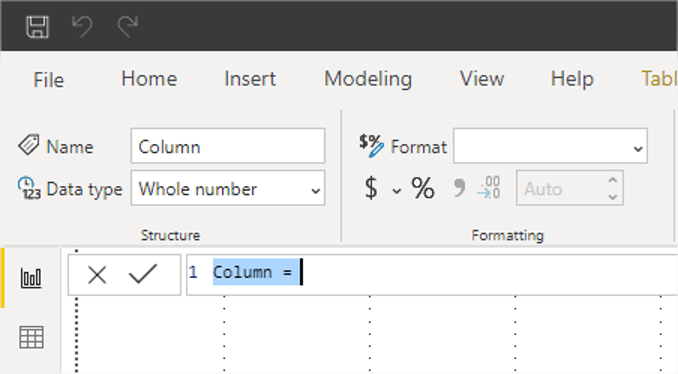
Because the formula is going to be evaluated row by row, you can reference other columns directly. For example, you can write the following formula:
Margin Column = Sales[Revenue] - Sales[Cost]
Once you write the formula and hit Enter, you can go to the Data view and see the new column:
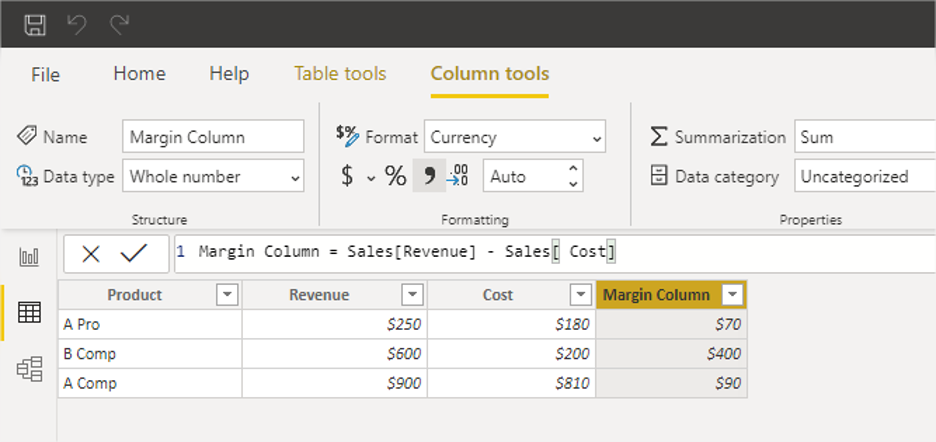
Note how each row displays a different value because the formula is evaluated for each row separately.
You can also see the new column in the Fields list:
Although we have successfully computed the dollar value of margin, we cannot compute the total margin as a percentage of revenue correctly. The following calculated column formula does not provide the correct results:
Margin % Column = Sales[Margin Column] / Sales[Revenue]
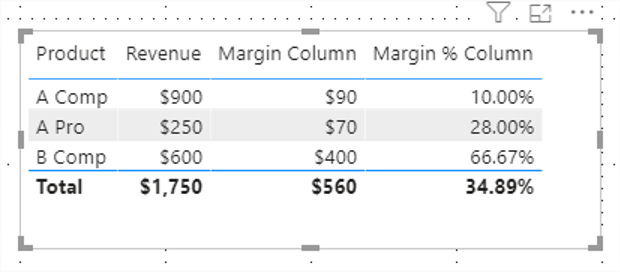
To verify this, we can create a table visual with Revenue, Margin Column, and Margin % Column:
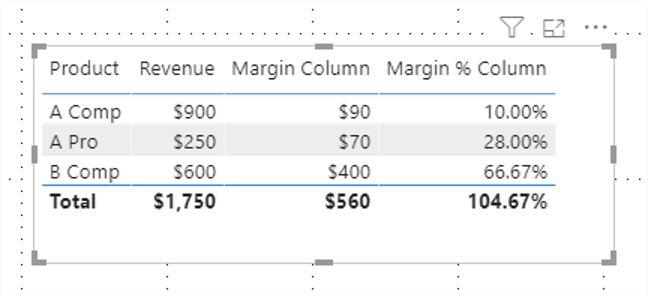
The correct Margin % at total level would be 560 / 1,750 = 32%. To understand what 104.67% means, it is useful to know that when you use a column field in a visual, an implicit measure is created, where the column values are aggregated using default summarization. To see what the default summarization for a column is, you can select the column in the Fields pane and see Column Tools, Summarization:
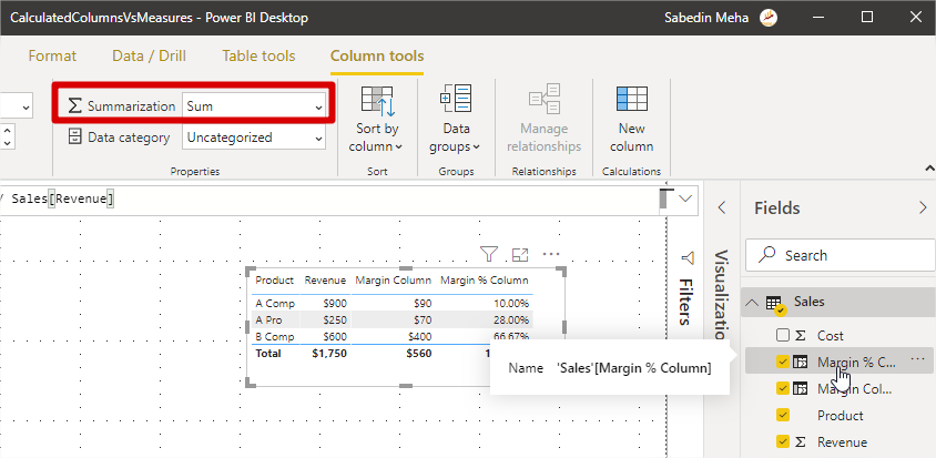
It is worth noting that every column in a data model has a default summarization. While in this case, it makes no sense to add percentages by using the Sum default summarization, this is what Power BI chose by default. We can either change the default summarization or change the summarization method for a particular visual by right-clicking on the field in the field well of the visual:
At this stage, we may be inclined to use the Average summarization instead of Sum. Even if we choose Average, the values will still be incorrect:
This is because Power BI now takes an arithmetic average of the column values; to arrive at 32%, what we need is a weighted average, and it is not possible to get it with a calculated column. In this case, we must write a measure.
Measures
A measure is a formula that is evaluated in the context in which it is used. For example, if you use a measure in a matrix visual, the formula will be evaluated for each matrix row and column combination separately. The closest equivalent of a measure from the Excel world is a PivotTable calculated field: you can see its result only when you use it in the PivotTable.
Because measures do not store their values directly in the data model, it is safe to say that they do not use any RAM for storage purposes. Instead, because they are evaluated with every interaction – for example, slicing or cross-filtering visuals – they use CPU at query time.
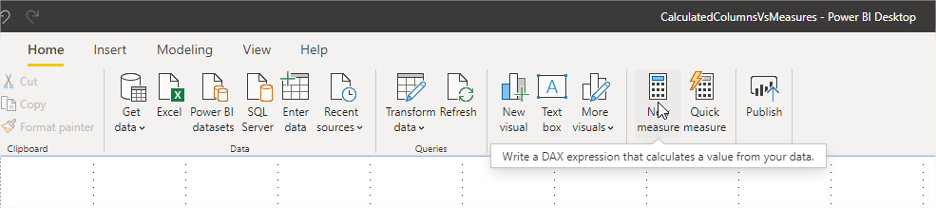
To create a measure, you can click Home, New Measure after you select the table where you want to create your measure in the Fields pane.
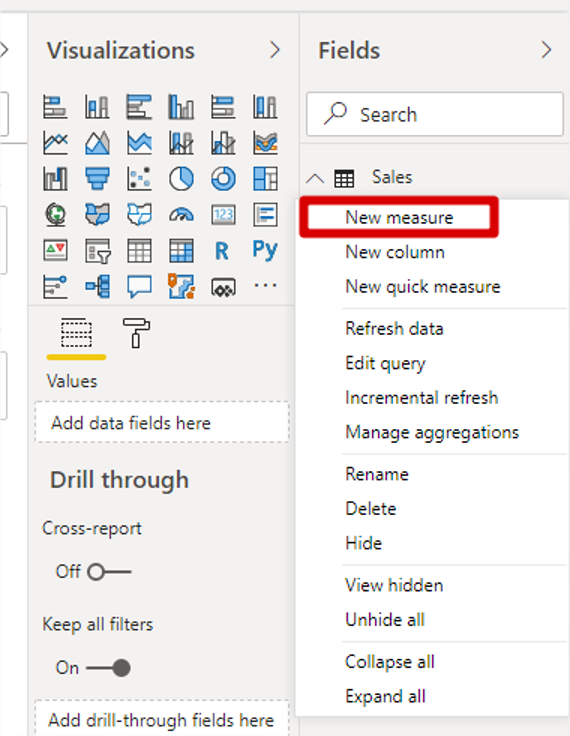
Alternatively, you can right-click on the table and select New measure.
Same as when you create a calculated column, the formula bar will appear and you will need to write your formula. You may notice that the formula that worked for the Margin Column calculated column won’t work for a measure:

This is because the measure is evaluated in the context in which it is used. Because of this, DAX does not know which row you refer to, or what you want to do with the column values – do you want to add them together, or take an average, or something else? For this reason, we need to use an aggregation formula in a measure, like SUMX:
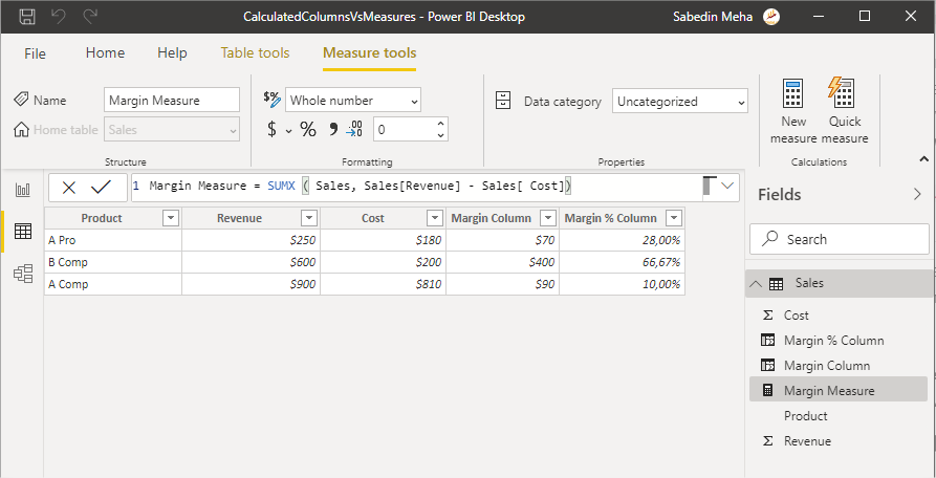
Margin Measure = SUMX ( Sales, Sales[Revenue] - Sales[Cost] )
SUMX receives two parameters: a table to iterate on (go row by row) and a formula to evaluate for each row. Note that the second parameter matches the formula of the Margin Column calculated column we created before; because of this, we will get the same results as when we use Margin Column in the Values field well.
Once you create the measure, you can see it in the Fields pane, but you will not see it in the Data view:
As mentioned above, because a measure is evaluated only when used, its results are not stored in the data model and cannot be seen unless you use a measure in a visual.
To calculate margin percentage, we need to come up with the logic first: to get the correct values, we need to divide the margin by revenue. We already have the Margin Column calculated column that we can aggregate, as well as the Revenue column. One of the ways to define the Margin % measure is as follows:
Margin % Measure = SUM ( Sales[Margin Column] ) / SUM ( Sales[Revenue] )
With this measure in place, we can get the correct margin percentage:

When to Use Calculated Columns and Measures
As you saw above, some calculations, like dollar value of margin, can be computed using both calculated columns and measures, while others, like margin percentage, need to be computed in measures. This may give an impression that measures are superior to calculated columns – this is not the case.
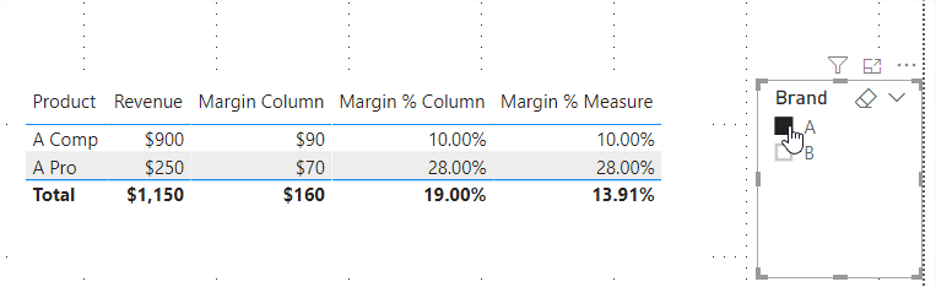
Not everything can be calculated with measures. For instance, let’s say that the Product column contains a concatenation of a brand and series: A Pro is a product of brand A, series Pro. If we want to separate brands and slice some values by brand, we have to create a calculated column because it is not possible to filter by a measure. In our case, we can use a formula like the following one:
Brand = LEFT ( Sales[Product], 1 )
This allows us to place the field in a slicer and filter by it:
Another scenario when you may want to use a calculated column over a measure is very complex calculations. If a measure takes a very long time to evaluate (say, over three seconds), then it may be a good idea to pre-compute some of its values in a calculated column and then use that column in an aggregation.
The following are the reasons to use calculated columns:
- Using values in a slicer, on an axis, or visual-, page-, and report-level filters, etc.
- CPU-intensive calculations to pre-compute some values for better user experience.
It is important to understand that calculated columns use RAM; the more columns you have, the bigger your data model will be.
In most cases, you can use measures, especially when you need to calculate ratios and weighted averages. Measures are evaluated at query time and mainly use CPU.
While Power BI already lets you build compelling visuals using only the fields you import from your data sources, further enriching your data model with your own calculations will make your reports infinitely more powerful.
Related Resources

The Path to Data Leadership: Embracing Embedded Analytics