


85%
Increase in user engagement

Build and embed interactive charts, graphs, and dashboards in your application. Real-time data, full branding, and governed analytics built for modern software products.
 4.5
 4.5

Based on980+reviews
"We love the little things like the timeline, undo, click to exclude, or zoom in. It’s just enough UI sizzle that seems to be pretty…
Based on980+reviews
"Historically, we would uncover an issue late in the process, and fixing it would take a long time. Logi Symphony has helped us tremendously with…

Based on980+reviews
"The ability to bring your own data and mix it with our platform data really sets us apart from our competition. No longer do our…


Most visualization tools show data as it was at export time — not as it is. Users discover discrepancies, trust erodes, and teams fall back to emailing CSV files because at least those are honest about being a point-in-time snapshot.
Open-source charting libraries like D3.js require significant engineering to look consistent with your UI. Every theme update and new chart type demands developer time.

Most visualization tools focus on displaying charts, not helping users understand what changed or why it matters. Teams end up exporting data, writing queries, and debating interpretations instead of getting clear answers from their analytics.
85%
Increase in user engagement
2000
hours of work saved each year
75%
Reduction in development time
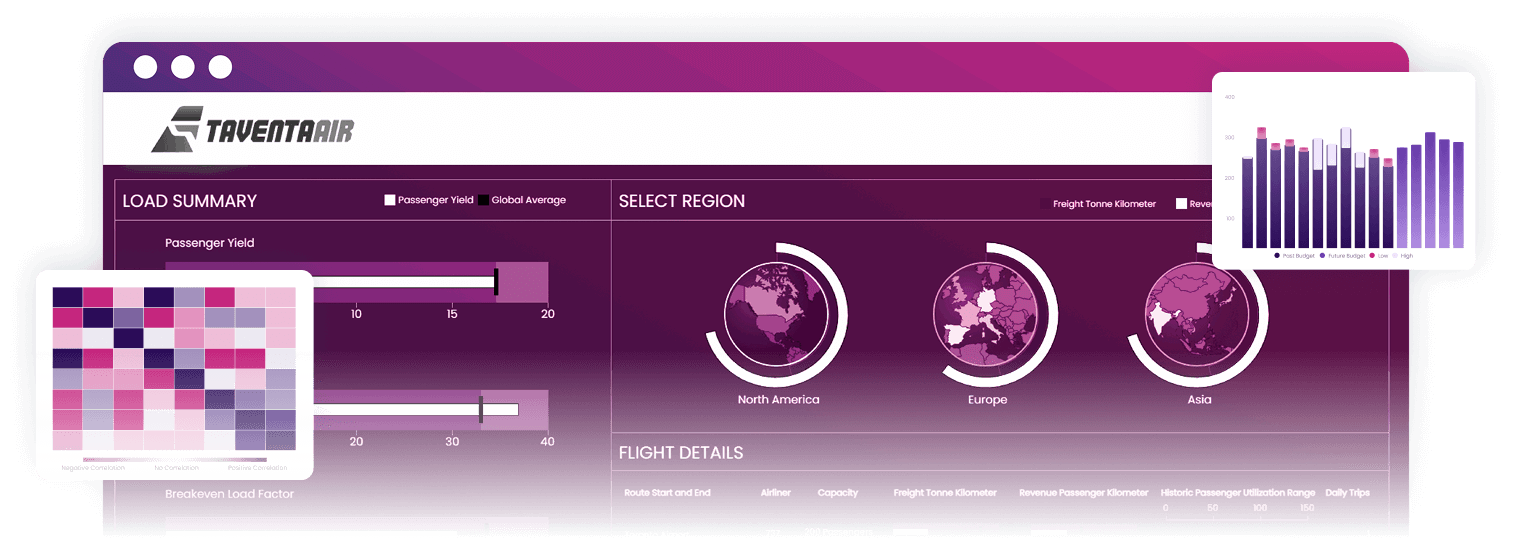
Create bar charts, scatter plots, heat maps, treemaps, and advanced analytical visualizations through a visual designer or API. Build interactive dashboards without assembling multiple chart libraries or writing custom visualization code.
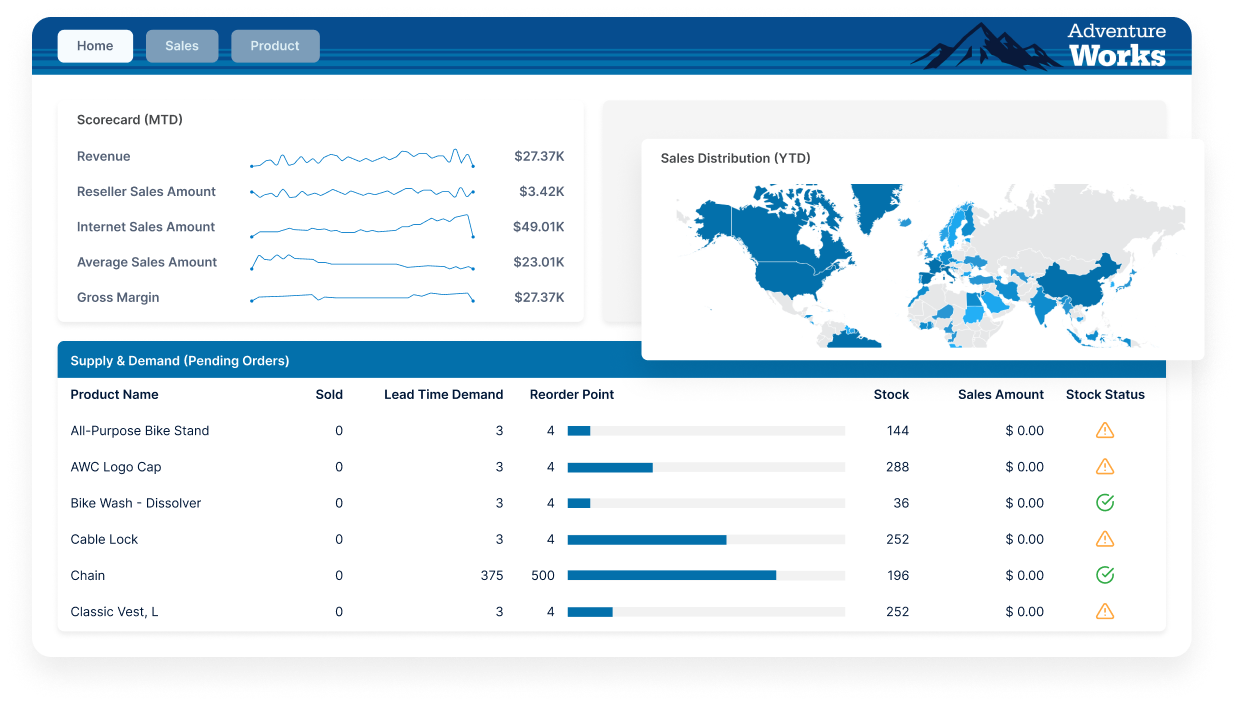
Charts connect directly to live data sources and refresh whenever users interact with a dashboard. Teams analyze current data instead of exporting reports or waiting for scheduled updates.
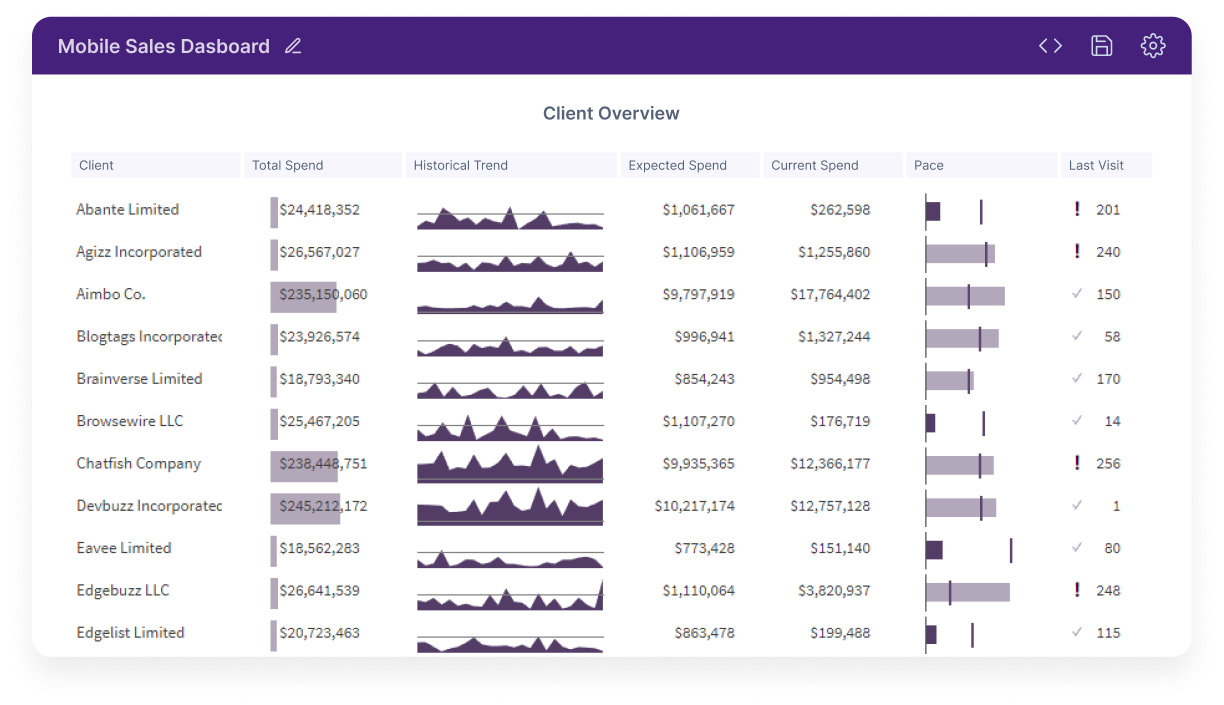
Apply your product’s color palette, typography, and design system across every chart using a centralized theming API. Visualizations inherit the look and feel of your application so analytics appears as a native part of the product experience.
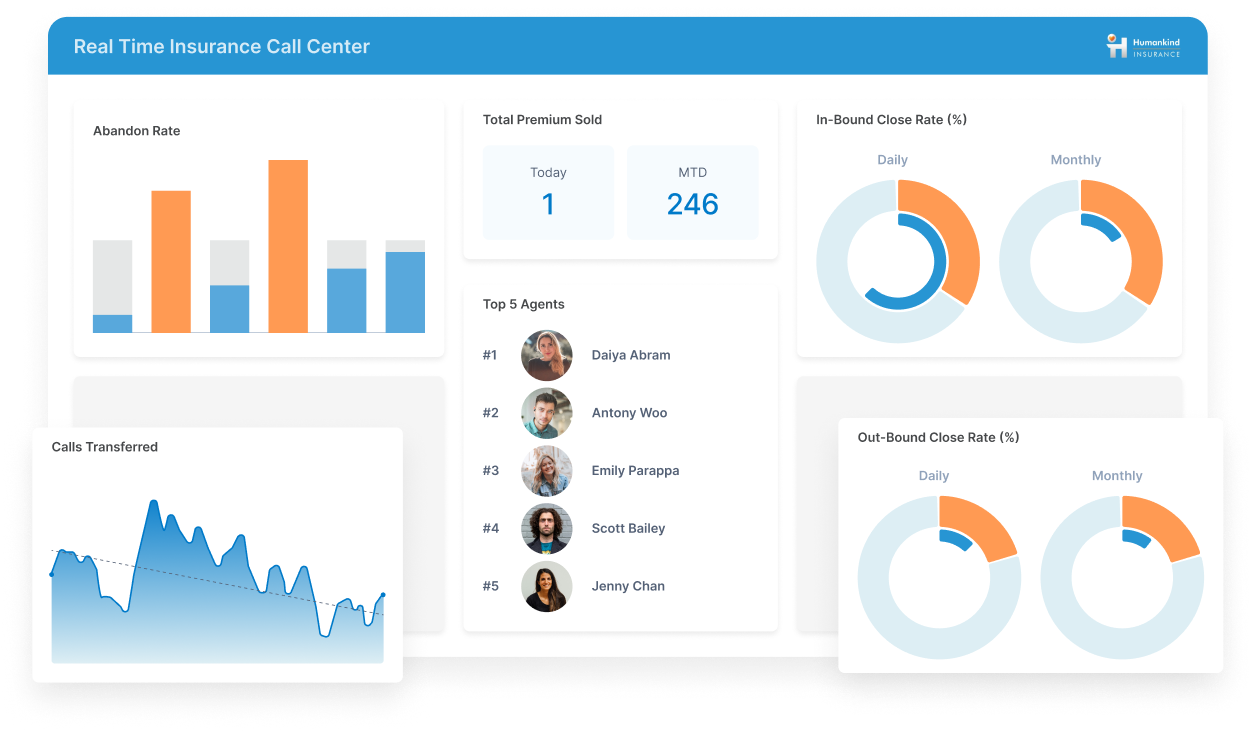
100+ chart types, live data connections, brand theming, and multi-tenant scale — everything needed to deliver compelling data visualization inside a production application.
100+ Chart Types
Live Data Connections
Drag-drop Chart Builder
Brand Theming API
Interactive Filtering
Multi-tenant Scale
Embeddable Components
REST API & JS SDK
AI Chart Summaries
4.54.5