Logi Tutorial: Plug-Ins for Creating Responsive Dashboards
This is the third blog in our tutorial series on 10 of the best solutions from Logi’s Expert-on-Demand (EOD) team. Today, we’re looking at two jQuery plug-ins that can dramatically improve the layout and responsiveness of your dashboards: GridStack and TableSelect.
GridStack provides a draggable, multi-column grid dashboard layout, while TableSelect turns any table into an element you can use to apply visualization changes across the dashboard. Together, these tools help you create a responsive dashboard with intuitive global dashboard panel filtering.
How to Use GridStack
For this example, we are utilizing Logi’s Report Center Item element to identify a panel’s inclusion within the dashboard. GridStack.js is a jQuery plugin that provides a responsive grid dashboard layout. To add panels to a GridStack, specify details in the ReportCenter Item’s ReportCenter Folder property:
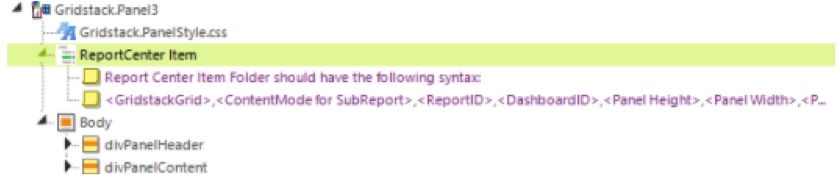
The Report Center Item Folder should have the following syntax:
<GridstackGrid>,<ContentMode for SubReport>,<ReportID>,<DashboardID>,<Panel Height>,<Panel Width>,<Panel x Location>,<Panel y Location>,<PanelID>
| GridstackGrid | Identifier for the GridStack grid this panel is associated with |
| ContentMode | Embedded, IncludeFrame, IncludeFrameAsync |
| ReportID | The Logi Definition ID including any Folder Identifier |
| DashboardID | Numerical identifier for dashboard |
| Panel Height | Panel height in units (the default grid is 12 units wide) |
| Panel Width | Panel width in Units (the default grid is 12 units wide) |
| Panel x Location | x-axis location of the panel starting with 0 (on the upper-left corner) |
| Panel y Location | y-axis location of the panel starting with 0 (on the upper-left corner) |
| PanelID | Numeric identifier for the panel |
GridStack has the ability to produce a JSON string in order to save the panel location. GridStack grids may be nested, which is useful when you have smaller KPI metrics to display. GridStack also supports multiple grids, giving end users the ability to drag and drop panels from one grid to another.
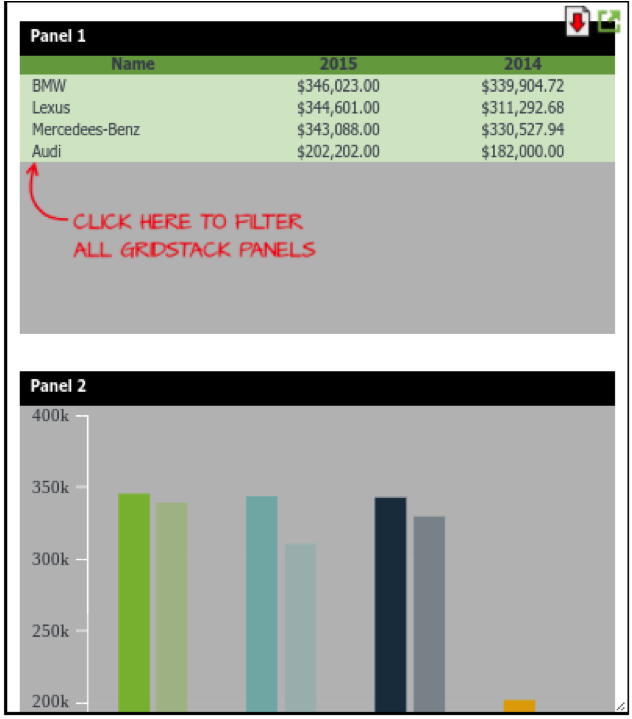
Simply clicking any of the items in Panel 1 allows the expansion mode. The other visualizations will then pop out:
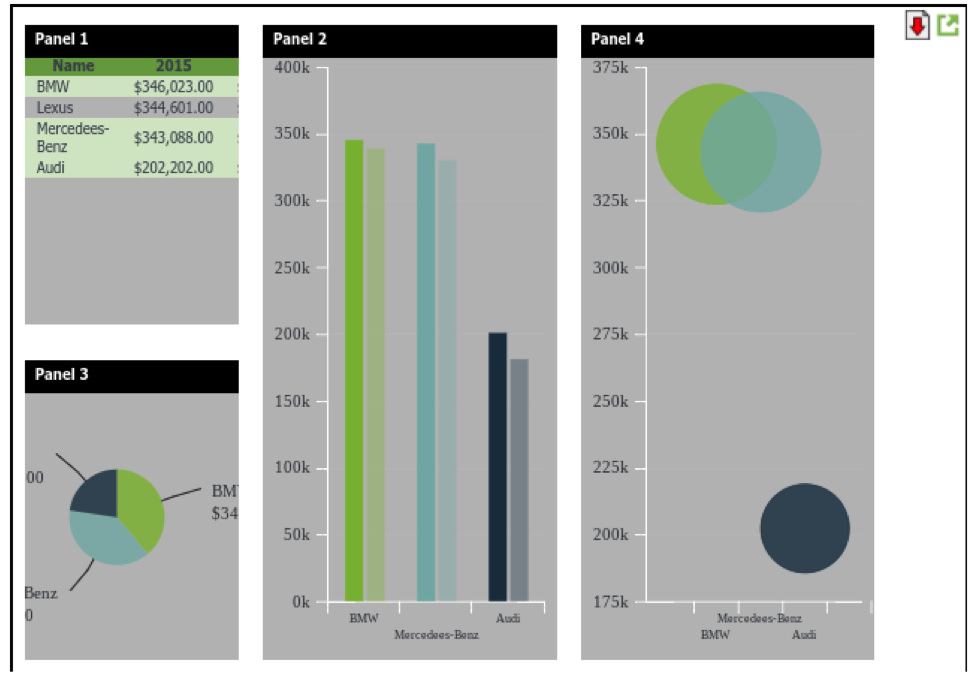
Using GridStack’s drag-and-drop feature, you can seamlessly move, stack, expand, minimize, and organize the panel as needed. And because GridStack uses Logi’s framework item, you can also add dashboard panels very easily.
See GridStack in action here >
How to Use TableSelect
TableSelect.js is a jQuery plugin that transforms a Logi DataTable into a Multi-Select Input Element – meaning you can change the visualizations on the entire dashboard based on a single selection.
TableSelect also allows you to pass multiple values. So in our example we have three columns, which means we can pass three input element values into the reports.
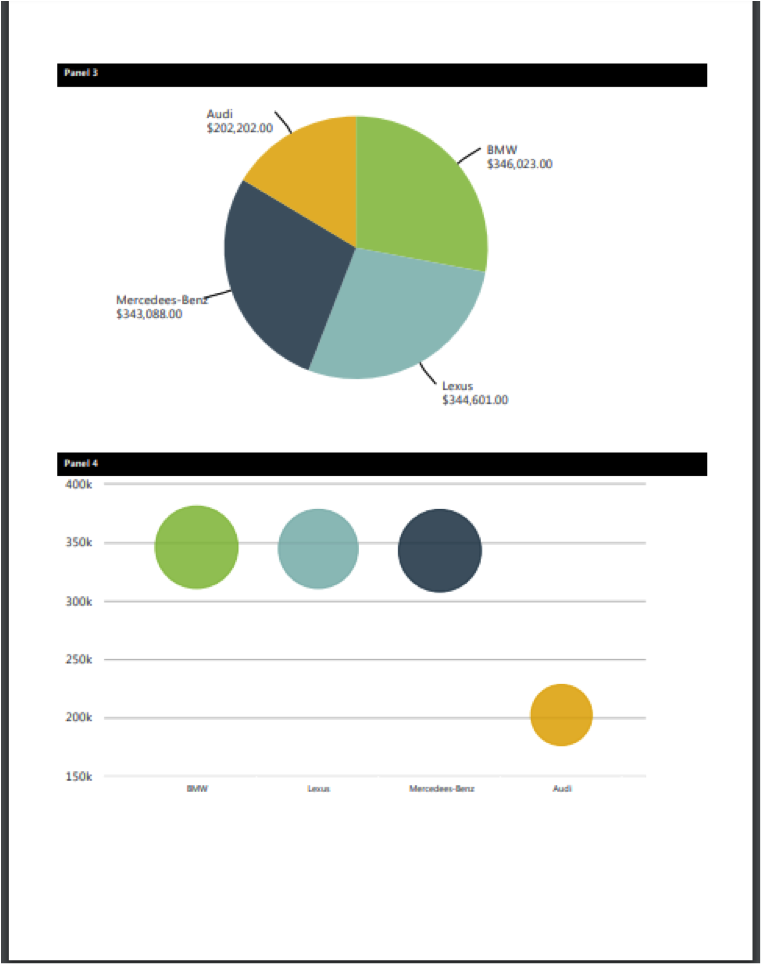
Finally, TableSelect and GridStack also include adaptive PDF functionality to automatically export your selected visualizations into one of Logi’s high-quality, page-measured PDFs.
Stay tuned to the Logi Blog for more Expert-On-Demand solutions, including Logi-style PDFs, in the following weeks.