How to Optimize Your Accounts Receivables Dashboards (with Examples)

Strong accounts receivable policies and processes, backed by robust internal controls, are essential for enterprise success. In the same way that people need to take in oxygen consistently, businesses need to excel at collecting revenue to thrive. That’s why so many rely on accounts receivable dashboards to provide transparency and enable oversight.
Accounts receivable dashboards offer a window into everything that matters with A/R. Users can quickly reference key metrics, see updated data in real time, and immediately understand the positives and negatives of performance.
Optimizing your dashboards is about maximizing their relevance, utility, and accessibility. Luckily, all of those factors are within your control. Follow these recommendations to create stellar accounts receivable dashboards that lead directly to more incoming revenue.
Include the Right Metrics
Including the right metrics ensures that your accounts receivable dashboard functions optimally and provides your business with the data it needs. All dashboards should include a clear indicator of outstanding accounts and overdue balances. Depending on their needs, users might also want to track additional metrics, such as average order value or percentage of overdue invoices. As long as the dashboard gives individual users the flexibility to choose which metrics they see, they will always focus on the right things.
Drill into the Data
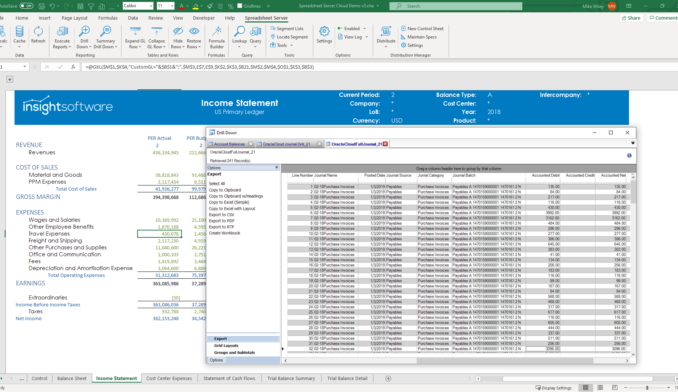
An accounts receivable dashboard should be an entry point, not an endpoint. When users can drill into the data on their dashboard, they can explore the underlying facts and figures to understand what kinds of issues are affecting performance. When this is possible, the dashboard becomes more than just a window into data—it becomes a tool for creating and connecting insights to improve the accounts receivable performance.
Incorporate Graphs and Charts
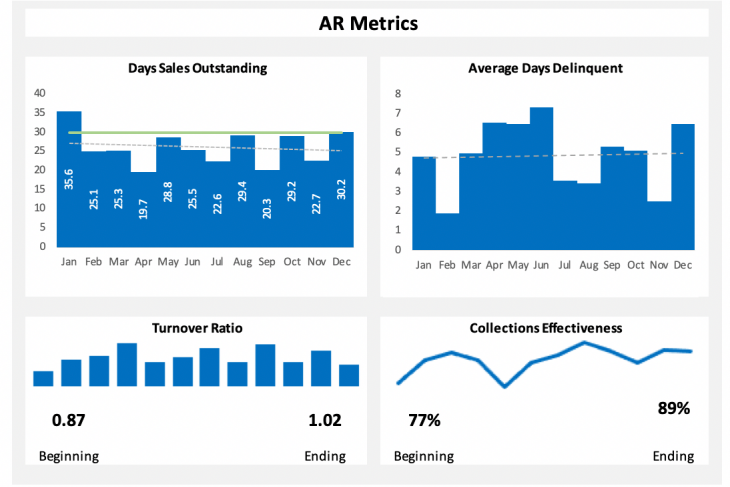
How the dashboard looks is just as important as what it includes. Information should be quickly and easily digestible, with the key takeaways highlighted. The goal is to glance at the dashboard and immediately be up to speed with the status of accounts receivable. Incorporating graphs, charts, and other kinds of visualizations along with raw data brings critical points into immediate focus. With these tools, users can see the relationships between the data and come away with actionable ideas. Appealing, intuitive visual design keeps the dashboard from becoming just another spreadsheet.
Extend Accessibility
If dashboards are an asset, stakeholders across the organization should be able to use them. That starts by extending access to more people both inside and outside the accounting department while still managing strict access controls to protect the data. Making dashboards more accessible also means making the tools more user-friendly and the interfaces more intuitive. Ideally, users without tech-savvy or accounting expertise can still rely on these dashboards to improve business performance based on a clear understanding of accounts receivable.
Incorporate Automation
Dashboards are designed to be an alternative to the traditional reporting process. Instead of having to hunt down information from multiple sources, it’s available at a glance (at least ideally). The better the dashboard, the less input it requires. Automation handles the heavy lifting so that decision-makers can spend more of their time focused on the implications of data and less time hunting down numbers, organizing spreadsheets, and trying to get an accurate analysis. In that way, dashboards both speed up the time necessary to make decisions and free up hours of time for other purposes.
Streamline Consumption
It’s easy to assume that if financial reporting dashboards are the best way to consume data, then the more data they contain the better. However, much of what makes these tools useful is that they streamline data into KPIs and omit anything that’s extraneous. As mentioned earlier, users can drill into the data and easily incorporate new metrics, but the dashboard itself is simple, straightforward, and sparse (relatively). Said differently, less is more when it comes to dashboards. Instead of trying to stuff as much as possible into one dashboard, do the opposite; cut out anything that doesn’t aid decision making or enhance clarity.
Upgrade the Culture
Somewhat paradoxically, the best way to improve dashboards of financial KPIs has nothing to do with the dashboards themselves. Consider that the best dashboards in the world do nothing to improve decisions if users ignore them. For any dashboard to have an impact, users need to consult it constantly before, during, and after making any decision. Doing that takes more than encouragement—it takes a data-driven company culture organized around the principle that good data lead to better decisions. Data-driven companies don’t just have dashboards, rather, they work to incorporate them as widely as possible and improve them on a continual basis. Any effort to improve financial reporting or do more with financial KPIs needs to include a technological component (dashboards) as well as a cultural component.
There is no model of a perfect accounts receivable dashboard because the definition is different for every company. Therefore, the single most crucial feature of any dashboard is adaptability. Whatever tool you rely on should be highly customizable and easy for average users to adjust on their own. Or, if you’re seeking a more comprehensive dashboard with visualizations, try out this interactive tool from insightsoftware.
Want something that you can download and make your own? Get our Accounts Receivable dashboard template and customize it with your own data.


